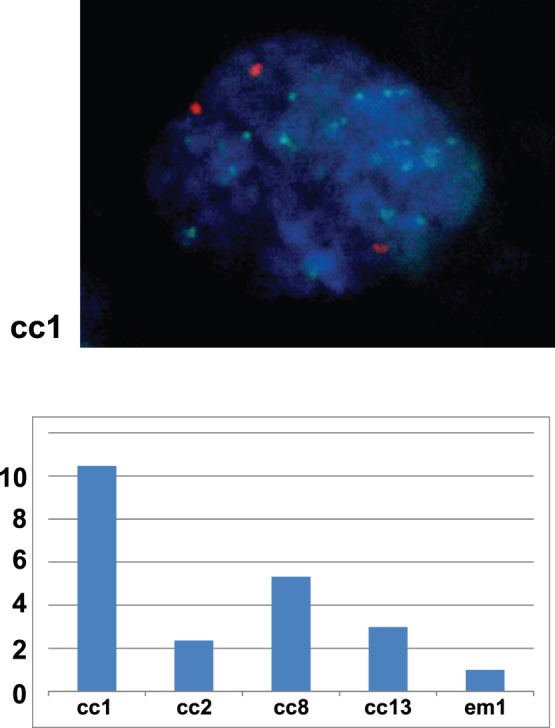
Figure 3. FISH analysis for confirmation of Met amplification.

A representative nucleus of a Met-amplified cell (cc1) is shown in the upper figure (Green: Met probe, Orange: CEP 7; centromere 7 probe, Blue; DAPI). The lower graph shows the FISH signal number (MET/CEP 7 ratio) of the 4 Met-amplified ovarian clear cell adenocarcinoma samples (cc1, cc2, cc8, cc13) and an endometrioid adenocarcinoma case (em1) without Met amplification. A total of 60 cells were counted for each sample, average numbers (Met: CEP7) were as follows; cc1(18∶2.0), cc2(4.4∶2.1),cc8(10∶2.2), cc13(4.6/1.7), em1(1.7/1.9). All values were then normalized with that of em1 as 1.0.
