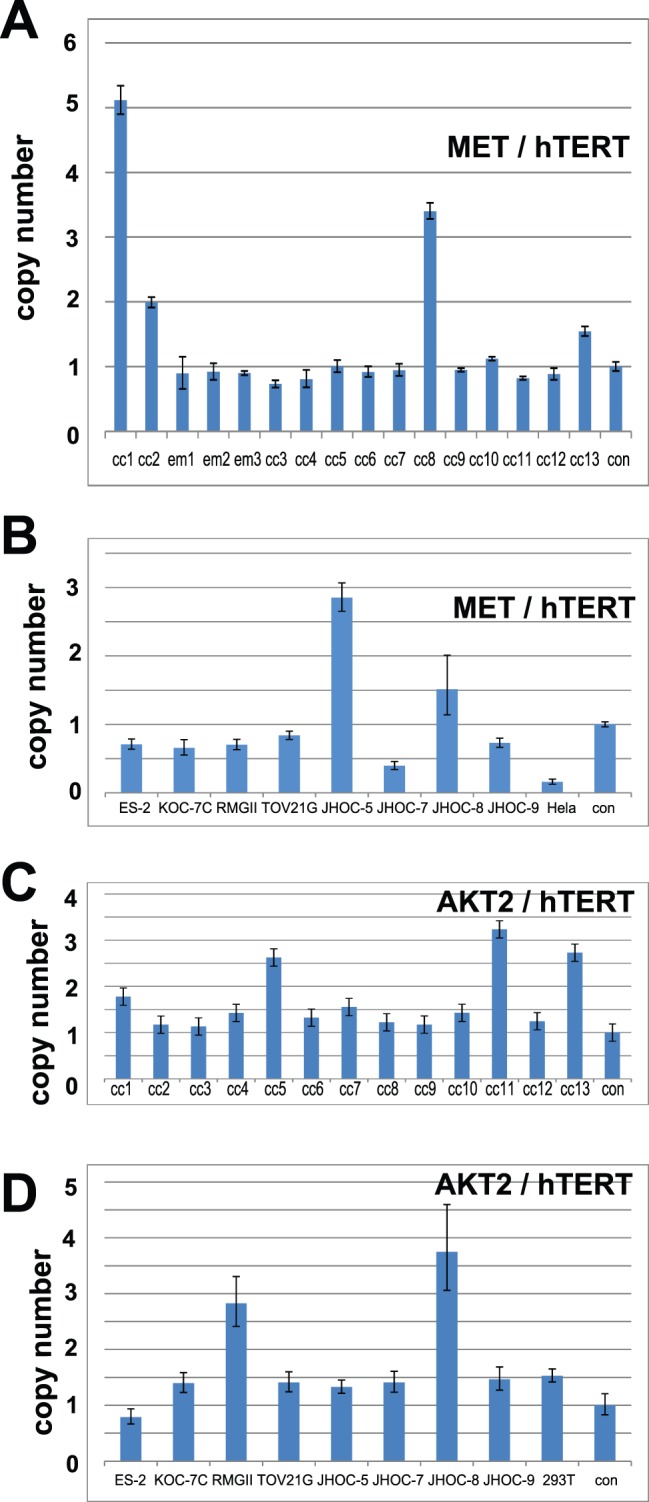
Figure 4. QPCR confirmation of Met and AKT2 amplification.

A. Copy number change analysis of Met in 13 ovarian clear cell adenocarcinoma samples are shown. Four samples (cc1, cc2, cc8, cc13) had a Met/hTERT ratio greater than 1.5. B. Copy number change analysis of Met in 8 ovarian clear cell adenocarcinoma cell lines are shown. Two cell lines (JHOC-5 and JHOC-8) had a Met/hTERT ratio greater than 1.5. C. Copy number change analysis of AKT2 in 13 ovarian clear cell adenocarcinoma samples are shown. Three samples (cc5, cc11, cc13) had an AKT2/hTERT ratio greater than 1.5. D. The qPCR results for the copy number change analysis of AKT2 in 8 ovarian clear cell adenocarcinoma cell lines are shown. Two cell lines (RMG-II and JHOC-8) had a Met/hTERT ratio greater than 1.5.
