
Figure 1. Activity patterns of cerebellar cortical cells in the rat.
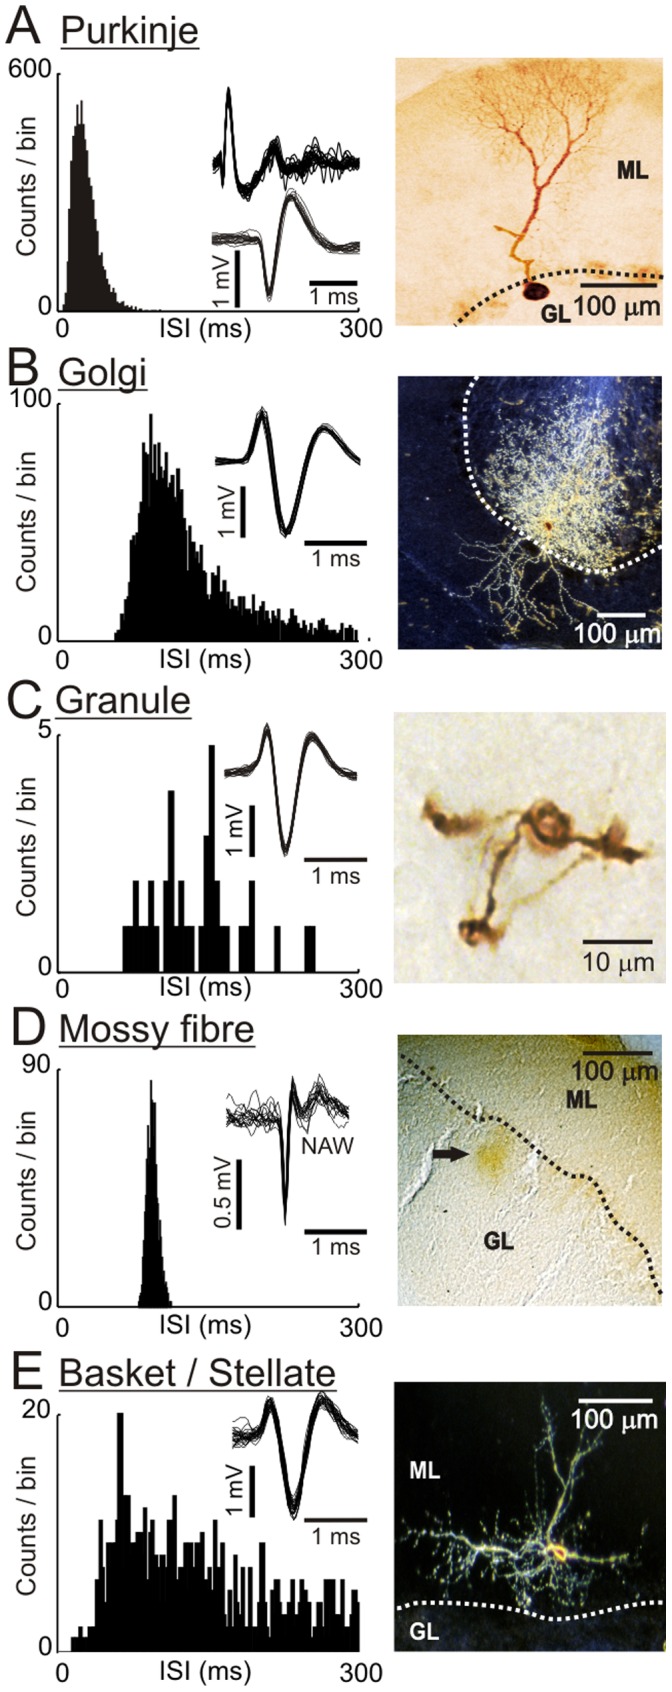
A shows an ISIH and spike-shapes (band pass 0.3–10 kHz) from an example Purkinje cell - note the presence of two spike-shapes, complex (top) and simple (bottom). The right panel shows a bright-field micrograph of a Purkinje cell following juxtacellular labelling with neurobiotin - note the characteristic dendritic arbor in the molecular layer (ML). B–E follow the same format for an example Golgi cell, granule cell, a regular firing mossy fibre terminal and basket/stellate cell, respectively. Although each of these granular layer units have broadly similar mean firing rates (compare the ISIHs), their intrinsic irregularities are divergent. Note that the spike-shapes shown for the Golgi cell, granule cell and basket/stellate cell are highly similar due to being recorded in the juxtasomatic configuration, whilst the spike-shape for the mossy fibre terminal is composed of an early fast and later variable negative after wave (NAW). The micrographs show a typical Golgi cell, viewed in dark-field, with dendrites extending into the ML and profuse, highly arborised axon tree in the granular layer (GL: note GL dendrites are not visible). In contrast, the much smaller granule cell shown in bright-field has a soma with three short dendrites. The micrograph in D shows a neurobiotin deposit in the upper granular layer following a juxtacellular labelling attempt with a regular firing mossy fibre unit (indicated by the arrow). Example data from a basket/stellate cell are shown in E, with a cell visible in the lower third of the molecular layer (ML) with arborisations extending in the parasagittal plane and presumed dendrites ascending in the plane of the Purkinje cell dendrites. Micrographs shown in A & B reproduced with permission from [7].