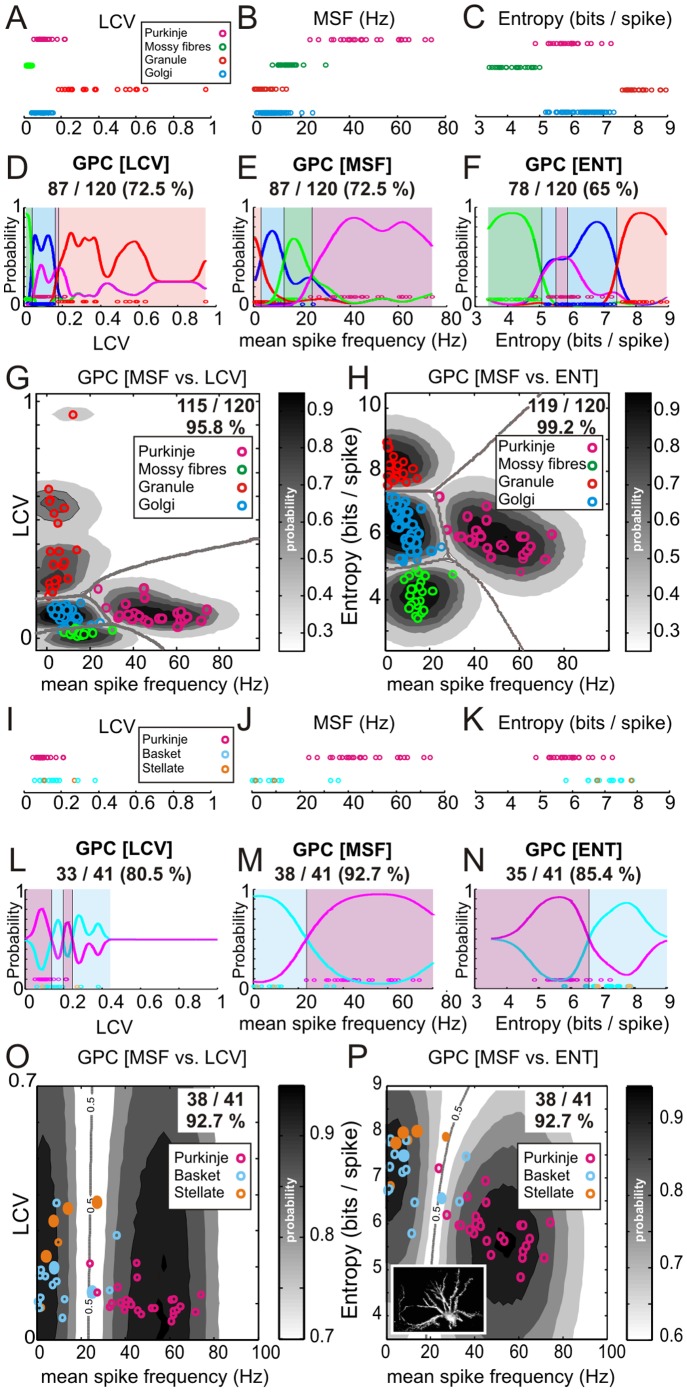
Figure 2. Firing frequency and firing irregularity measures for granular layer and molecular layer neurones.
Three of the most useful statistics, CV of log ISIs (LCV), mean spike frequency (MSF) and log-interval-entropy (ENT), for classifying cells into distinct classes are plotted in A–C for the granular layer cells and I–K for the molecular layer cells. Each circle represents the spike train statistic of a single neurone (n = 120 cells and 41 cells, respectively). These data were used to build Gaussian Process Classifiers (D–F and L–N, respectively) using a single statistic to infer probabilities for each neurone belonging to a class and to delineate equiprobable decision boundaries between cell classes (solid black lines). Classification accuracy for each statistic is provided above each plot. G & H show the outcome of Gaussian Process Classifiers built using a twin-variate approach for the granular layer cells and O & P show the same analysis for the molecular layer cells (note inset labelled basket/stellate cell [cat]). Probability contours are superimposed for each class (probability levels = 0.25, 0.4, 0.6, 0.7, 0.8, 0.9 & 0.95) as well as the 2-dimensional decision boundaries and a resultant increase in classification accuracy (included in top right of each panel).

