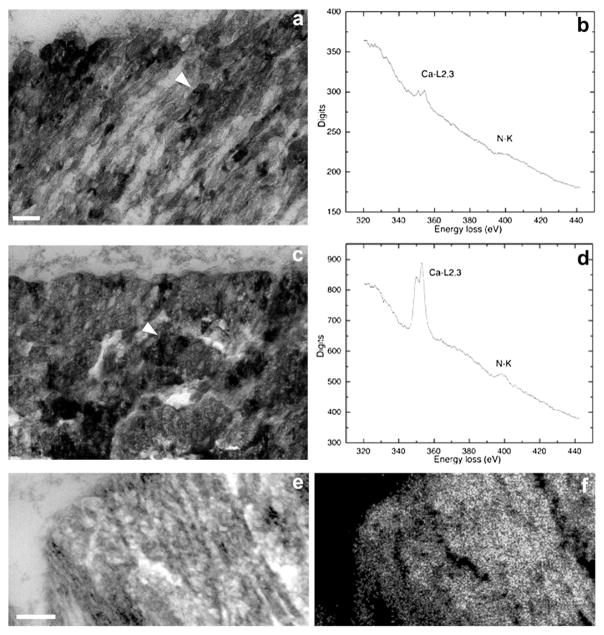
Fig 5.
Analytical TEM demonstrates co-localization of mineral and organic phases. (a) TEM of the outer cortex of a mouse otoconium showing several small electron-dense mineral particles framed by fibrillar scaffolds (arrowhead); (b) electron energy loss spectrum of region indicated by arrowhead in (a), showing low peaks for both, calcium and nitrogen (markers for calcium carbonate and protein, respectively); (c) electron-micrograph of outer cortex showing a more advanced stage of mineralization than (a). The arrow points to the growing crystallites, which obscure fibrillar scaffold. The corresponding EELS shows a much higher calcium peak than (b), with the N peak unchanged (d); (e) elemental mapping of calcium of mouse otoconium in a zero-loss filtered image. Parallel columns of crystallites are separated by electron-lucent material (arrowhead); (f) calcium map of region depicted in (e). Bars = 0.1 μm for (a) and (c), 0.3 μm (e) and (f).

