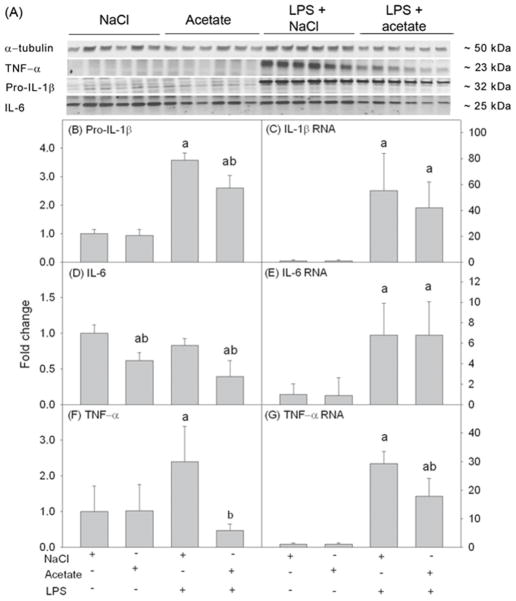
Fig. 4.
Pro-inflammatory cytokines pro-IL-1β, IL-6, and TNF-α in primary mouse astrocyte cell cultures stimulated for 4 hr with LPS 6.25 ng/ml and/or 12 mM sodium acetate, with 12 mM NaCl as control. Panel A shows representative images of the Western blots. Panels B, D and F show the optical densities of the pro-inflammatory cytokines pro-IL-1β, IL-6 and TNF-α, respectively, normalized to the loading control α-tubulin (n = 6). Panels C, E and G show the changes in the mRNA levels of the pro-inflammatory cytokines IL-1β, IL-6 and TNF-α, quantified by qrt-PCR and normalized to β-actin (n = 6). All values represent the mean fold change relative to control ± SD. Statistical significance (a = compared to NaCl, and b = compared to LPS) was set at p ≤ 0.05, as determined by One Way ANOVA followed by Tukey’s post-hoc test.

