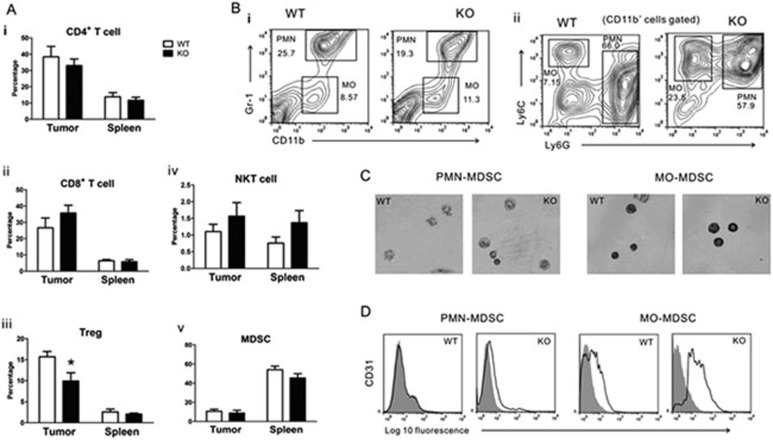
Figure 2.
Aberrant differentiation of MDSCs in CCL5 KO mice. (A) At 2 weeks after 4T1 cell inoculation, tumor-infiltrating cells and splenocytes from WT and KO mice were analyzed by flow cytometry. Percentages of CD4+ T cells (i), CD8+ T cells (ii), Treg cells (iii), NKT cells (iv), and CD11b+Gr-1+ cells (v) are indicated with mean and SD. (B) Splenocytes from tumor-bearing WT and KO mice were stained for expression of CD11b and Gr-1(i); the CD11b+ subset was further analyzed for Ly6G versus Ly6C expression (ii). (C) Sorted MDSC subsets were stained with May-Grünwald Giemsa to evaluate their morphology. Original magnification, 400×. (D) Sorted MDSC subsets were stained for CD31 expression. *P < 0.05. n = 5 mice per group.

