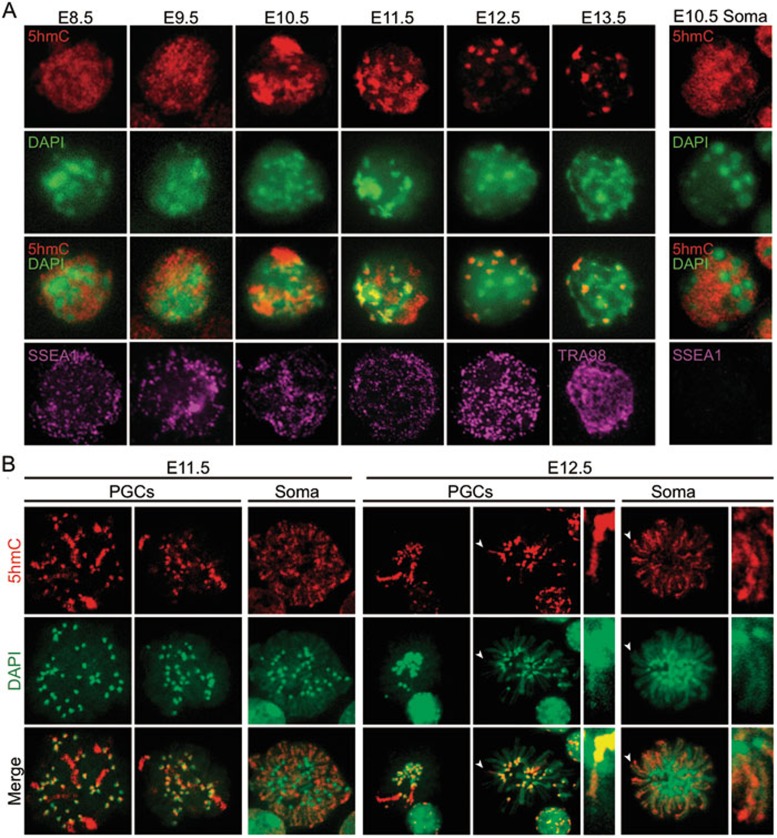
Figure 2.
Subnuclear localization dynamics of 5hmC during PGC reprogramming. (A) Representative images of reprogramming PGC nuclear staining with 5hmC (red), DAPI (green), and germ cell markers (SSEA1 and TRA98) of surface spreads. The highest signal intensity was detected in the E10.5 PGC nucleus. Enrichment of 5hmC at the chromocenters starts from E10.5 and became obvious from E11.5. Since neighboring somatic cells show no change in 5hmC pattern through development, only a representative image of E10.5 embryo is shown (right panel). (B) Representative images of chromosome spreads of E11.5 and E12.5 PGCs and somatic cells co-stained with 5hmC antibody and DAPI. PGCs and somatic cells were purified by FACS sorting based on the expression of an Oct4-GFP transgene. Note that only a few chromosomes have intense signal in the chromosome body in PGCs, while all chromosomes are broadly stained in somatic cells. Arrowheads indicate enlarged chromatids shown in the adjacent panels.

