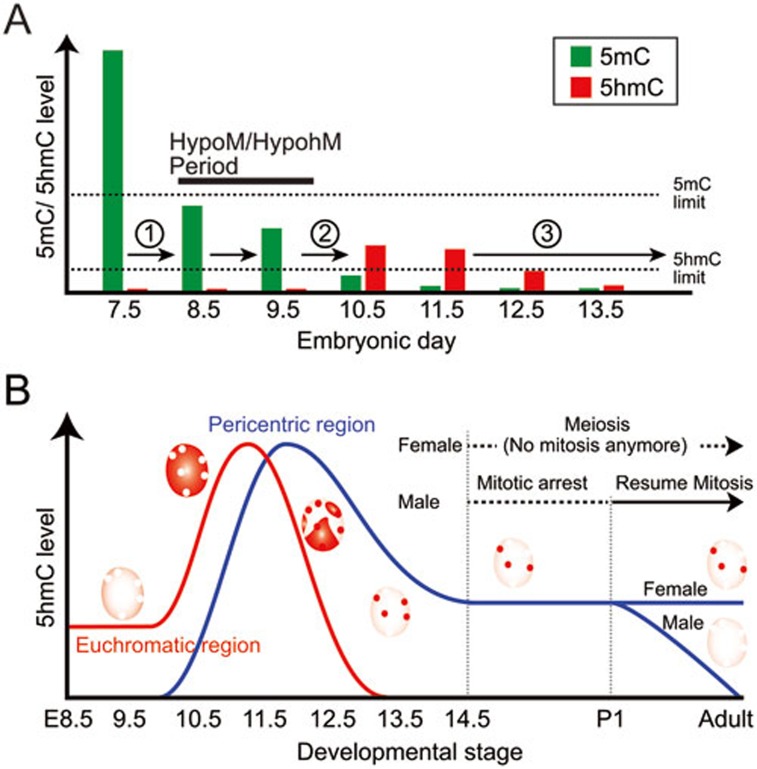
Figure 6.
Diagrammatic illustration of the 5mC and 5hmC dynamics and distribution pattern during germ cell development. (A) Diagrammatic illustration of the three steps of DNA demethylation during PGC reprogramming. (1) Loss of bulk DNA methylation takes place in a Tet-independent manner. (2) Oxidation of remaining 5mC to 5hmC by Tet proteins. (3) Replication-dependent dilution of 5hmC. Detection limit of 5mC and 5hmC by immunohistochemistry is indicated by dashed line. HypoM/hypohM, hypomethyl/hypohydroxymethylation. (B) Diagrammatic illustration of 5hmC subnuclear localization pattern during germ cell development. 5hmC level in euchromatic (red line) and pericentric (blue line) region is indicated. Note that the fates of pericentric 5hmC in late stage male and female germ cells are different.

