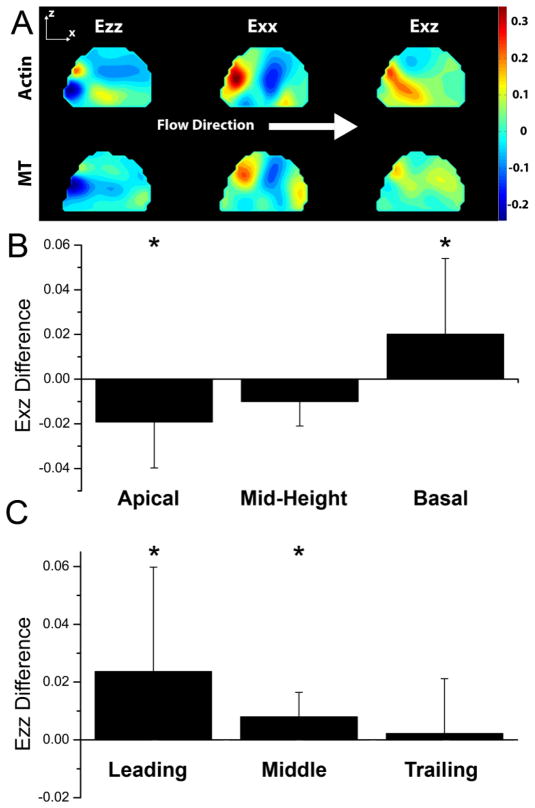
Figure 3.
A) Strain contour plot of steady flow strains at the end of the loading period. The side-view strains of the actin and MT networks are presented from the same cell. Between the networks, the magnitudes of strains are different, and areas of tension and compression do not coincide in all areas, such as in Ezz in this cell. B) Mean of the paired differences within each cell between the Actin and MT Exz strains at different locations in the cell at the end of the steady flow loading period. In the apical region of the cell, Actin Exz was significantly lower than MT Exz (p<0.01). In the basal region of the cell, the Actin Exz was significantly greater than MT Exz (p<0.05). C) Mean of the paired differences within each cell between the Actin and MT Ezz strains at different locations in the cell at the end of the steady flow loading period. In the leading (p=0.05) and middle (p<0.05) regions of the cell, Actin Ezz was significantly higher than MT Ezz when comparing the paired differences between the two strains within each cell. Error bars represent standard deviation.

