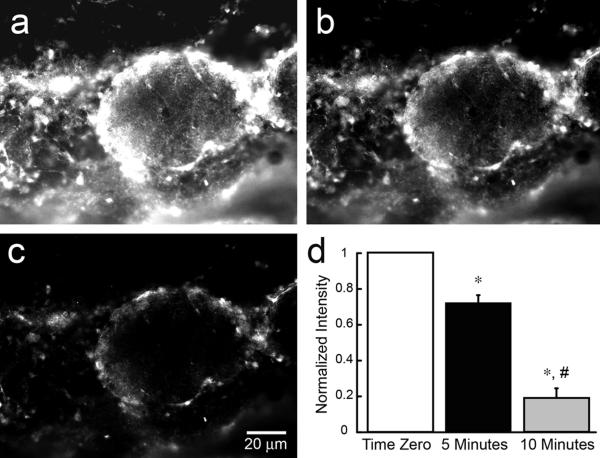
Figure 2.
Chelation of zinc with TPA reduces the signal from ZP1. OB slices were incubated in 30 μM ZP1 for 30 min after which 30 μM of the zinc chelator, TPA, was added. The images show high magnification views of the glomerular layer. a) The signal at time zero show intense fluorescence from ZP1 binding of zinc within glomeruli. b) The signal is reduced 5 min after application of 30 μM TPA. c) Most of the signal is eliminated 10 min after TPA. A quantitative group analysis (ImageJ) of the change in the signal over the 10-min incubation with TPA is shown in panel (d). Signal intensities have been background subtracted and normalized (n=3). A statistical difference between time zero and 5 min (p < 0.01) and 10 min (p < 0.0001) time points is indicated by the *. A statistical difference between the 5 min and 10 min time points (p < 0.01) is indicated by the #.

