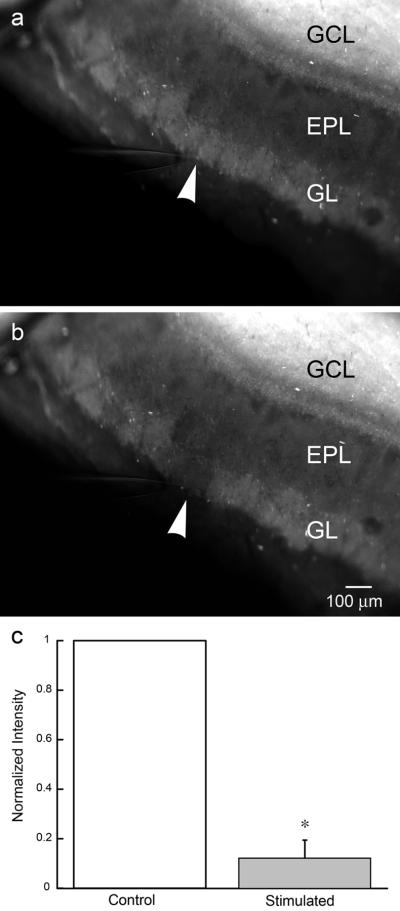
Figure 4.

Evoked release of glomerular zinc with patterned electrical stimulation. a) OB slices incubated in 30 μM ZP1 for 30 min reveal a laminar distribution of vesicular zinc. The stimulating electrode is in place prior to stimulation. b) A pattern of electrical stimuli, designed to mimic the breathing cycle (five bursts, three pulses at 100 Hz separated by 250 ms) and delivered to the olfactory nerve layer for 10 min, evoked release of zinc from glomeruli adjacent to the stimulating electrode. c) A quantitative group analysis (ImageJ), of the background subtracted and normalized zinc fluorescence before and after electrical stimulation, shows the reduction in the zinc signal evoked by electrical stimulation (n=3). A statistical difference between the control and the stimulated signal intensity (p < 0.002) is indicated by the *. The position of the tip of the stimulating electrode in (a) and (b) is indicated by the white arrowhead. GCL (granule cell layer); EPL (external plexiform layer); GL (glomerular layer).
