
Fig. 7.
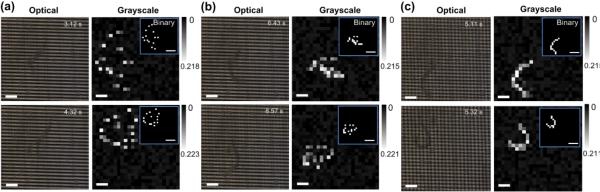
Optical images and reconstructed grayscale, and binary images of a C. elegans swimming in the MEF grids at two different time points with different full-frame scanning frequency fsc = 8 Hz (a), 70 Hz (b), and 100 Hz (c). The grayscale and binary images were obtained from the electrical measurements. Scale bars in the optical and grayscale images represent 100 μm. Scale bars in the binary images (see insets) represent 200 μm.