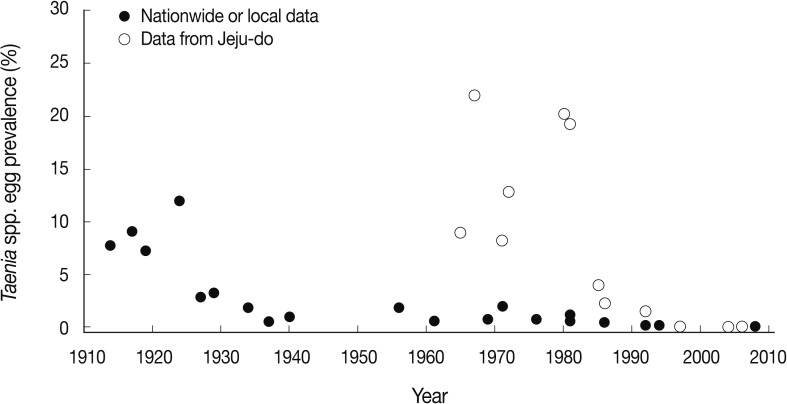
Fig. 2.
Graphic presentation of the decreasing patterns of Taenia spp. egg positive rates in Korea. Data are from nationwide or local figures presented in Table 1 from 1914-2008 and from Jeju-do in Table 2 from 1965-2006. Note the remarkably higher egg positive rates in Jeju-do compared to the national figures or data from other local areas during 1965 and 1990.

