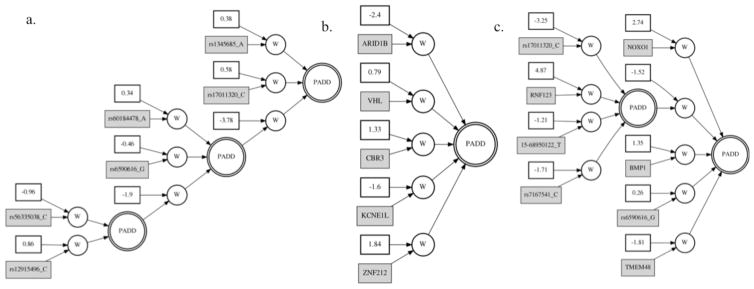
Fig 4.

Best GENN models from the a. SNP, b. EV, and c. SNP and EV integrated analyses. The asterisks in the integrated model denote variables that were present in at least one of the top five cross validation models from the separate SNP and EV analyses. (w = constant and variable are multiplied; PADD = additive activation node)
