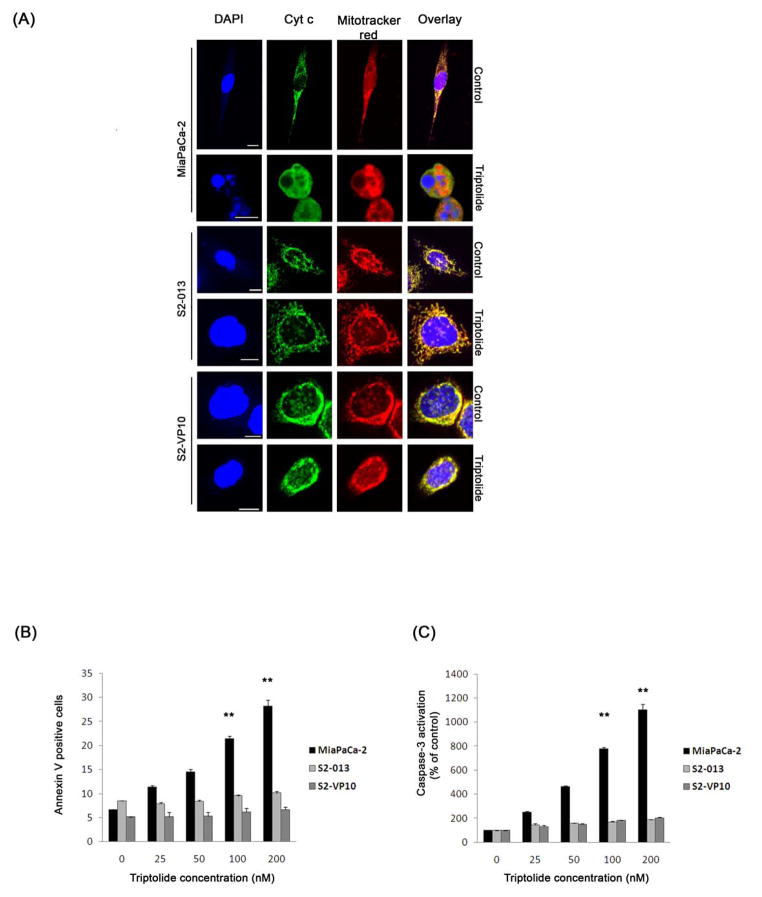
Figure 2. Effect of triptolide treatment on the markers of apoptosis in pancreatic cancer cells.
(A) Treatment of MiaPaCa-2, but not S2-013 and S2-VP10 cells, shows a release of cytochrome c into the cytosol. Cytochrome c (green, punctate) colocalizes with mitotracker red (red, punctate) in untreated cells. The nuclei have been stained with DAPI (blue). Scale bar is 10 μM. (B, C) Treatment with triptolide for 24 h shows a significant increase in Annexin V staining and caspase-3 activation in MiaPaCa-2 cells but not in S2-013 and S2-VP10 as compared to the control. The bars represent mean ± SEM, n≥3, **p<0.01 (t test).

