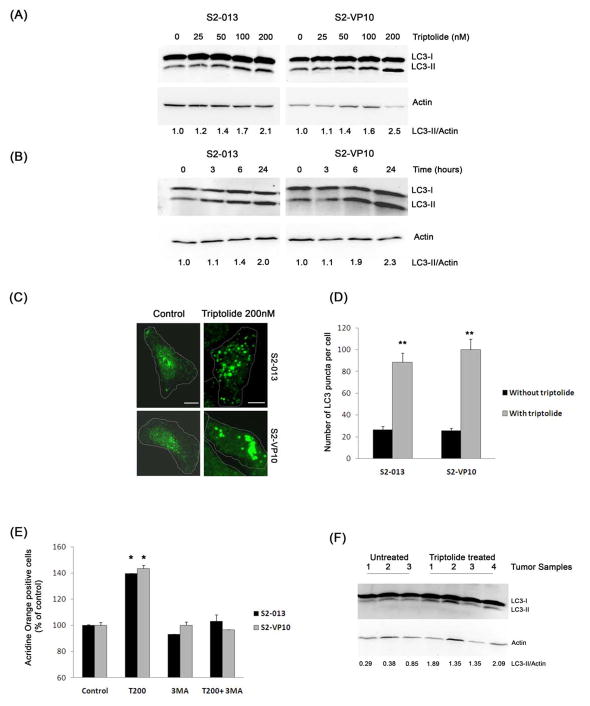
Figure 3. Effect of triptolide on autophagy in pancreatic cancer cells.
≥S2-013 and S2-VP10 exposed to increasing concentrations on triptolide for 24 h (A) or to triptolide 200 nM for indicated times (B) show a time- and dose-dependent increase in the autophagy-specific-LC3-II protein. The relative levels of LC3-II to Actin (loading control) are indicated below the corresponding bands. (C and D) Treatment of S2-013 and S2-VP10 cells with triptolide 200 nM for 24 h shows a significant increase in the LC3 punctate staining pattern when compared with untreated cells. The white dotted line indicates the outline of the cells. Results shown are representative of four independent experiments. Scale bar is 10 μM. (E) S2-013 and S2-VP10 cells exposed to triptolide 200 nM but neither 3-methyl adenine (3-MA) 2 mM alone nor the combination for 24 h shows a significant increase in red fluorescence compared to untreated cells. (F) Triptolide-treated S2-013 orthotopic tumor samples show an increase in LC3-II levels compared to untreated tumor samples. The bars represent mean ± SEM, n=3, *p <0.05, **p<0.01 (t test).

