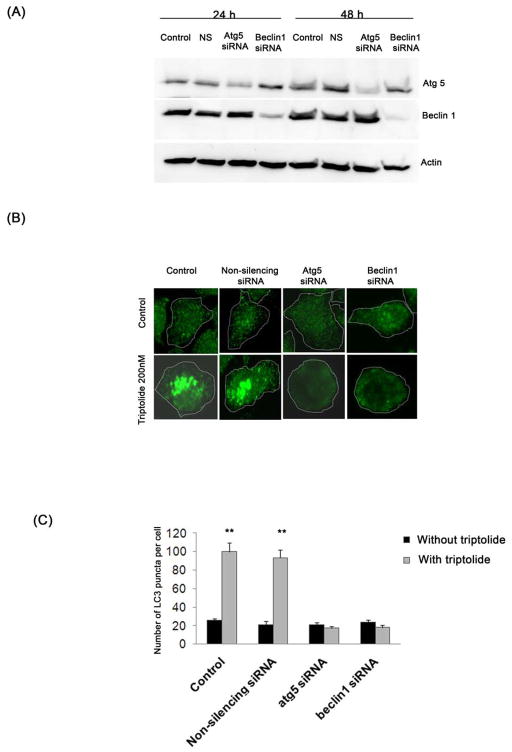
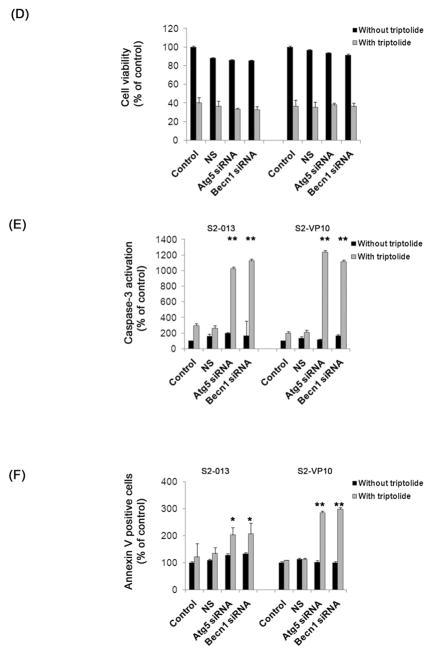
Figure 6. Effect of triptolide on S2-013 and S2-VP10 cells after a knock-down of autophagy-specific genes.
(A) Treatment of S2-013 cells with a pool of either atg5 siRNA or beclin1 siRNA shows a significant decrease in Atg5 or Beclin1 levels after 24 h and 48 h, which is absent in cells treated with lipofectamine alone (control) or with non-silencing siRNA (NS). Actin is used as a loading control. (B, C) Treatment of S2-013 with 200 nM triptolide for 24 h following a knock-down of atg5 or beclin1 genes with siRNA pool for 48 h shows a significant decrease in LC3 punctate pattern as compared to cells treated with non-silencing siRNA or lipofectamine alone followed by triptolide. The white dotted line indicates the outline of the cells. S2-013 and S2-VP10 cells treated with triptolide 200 nM for 48 h following atg5 or beclin1 knock-down shows a decrease in cell viability which is comparable to control or NS cells treated with triptolide (D). Knock-down of atg5 or beclin1 followed by triptolide 200 nM treatment for 48 h (E) or 24 h (F) shows a significant increase in caspase-3 activation and Annexin V positive cells when compared to control or NS cells treated with triptolide. The data shown are representative of three independent experiments. The bars represent mean ± SEM, n=3, * p<0.05, **p <0.01 (t test).


