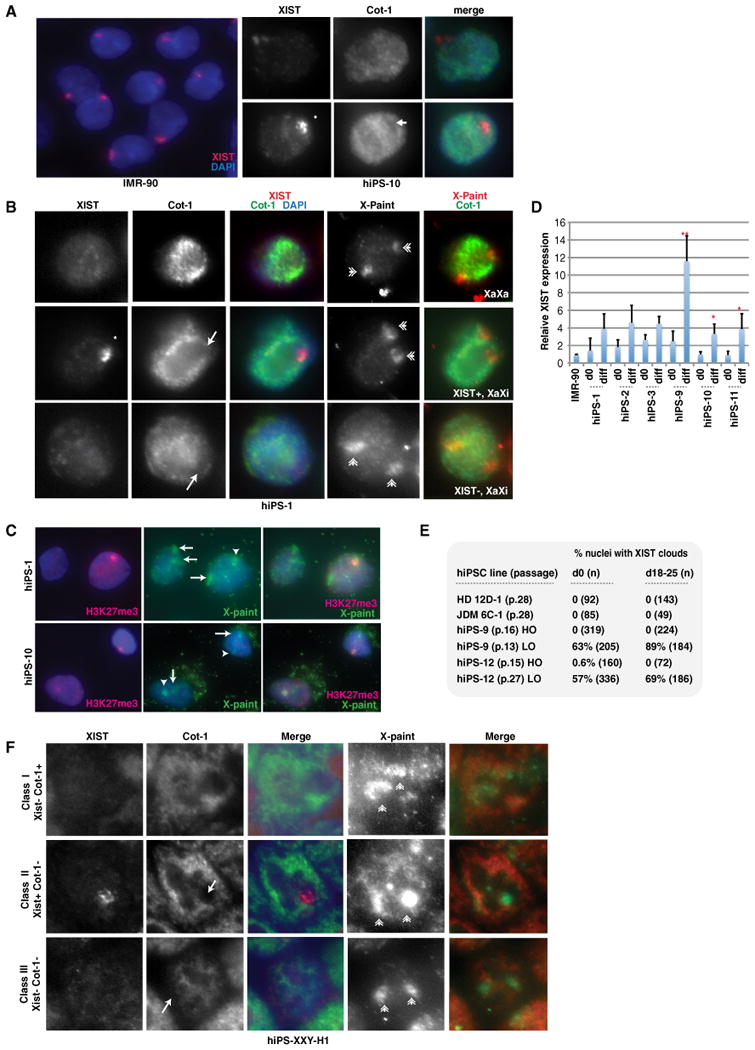
Figure 1. Partial X Reactivation and High-Frequency Class III Conversion in Female hiPSCs.

(A) RNA FISH of IMR-90 and undifferentiated hiPS-10. XIST RNA, red; Cot-1 RNA, green; asterisk, XIST cloud; arrow, COT-1 hole.
(B) RNA FISH for XIST and Cot-1, followed by X-paint DNA FISH. Arrows, Cot-1 holes; asterisk, XIST cloud; double arrowheads, X chromosomes. Shown is hiPS-1 p.6.
(C) Immunostaining for H3K27me3 (red) followed by DNA FISH (green) for X chromosomes in differentiated (d16) hiPSCs.
(D) Real-time PCR of XIST expression. Ct values were normalized to IMR-90 cells (set to 1) and GAPDH, and values represent averages of triplicates. Error bars indicate standard deviations (SD) of the mean. p values were calculated with one-tailed Student's t test assuming equal variance; *p = 0.04; **p = 0.004. See also Figure S4.
(E) Summary of XIST RNA FISH. n, sample size. LO, 4% oxygen; HO, 20% oxygen.
(F) Three classes of XXY hiPSCs (d0, p.4). Arrows, Cot-1 holes; asterisk, XIST cloud; double arrowheads, X chromosomes. See also Figure S5.
