
Fig. 2.
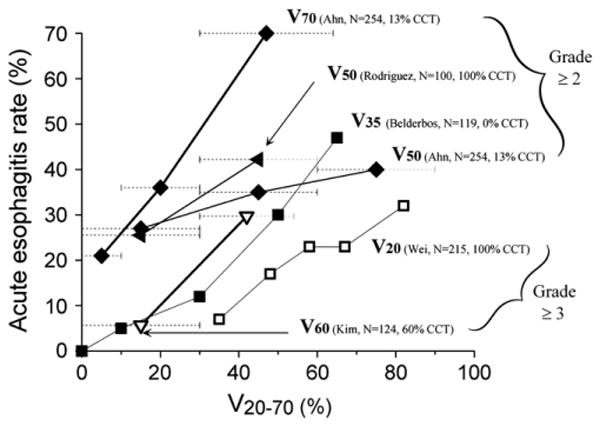
Incidence of acute esophagitis according to Vx (volume receiving more than x Gy). x-Axis values estimated according to range of doses reported. Each curve annotated as follows: Vdose (investigator, number of patients, percentage with concurrent chemotherapy [CCT]. Percentage of patients who received sequential chemotherapy in studies by Ahn et al. (11), Belderbos et al. (19), and Kim et al. (20) was 44%, 38%, and 15%, respectively. Data for V50 (Ahn et al. [11]) at 15, 45, and 75 Gy represent reported rates of Grade 2 or greater acute esophagitis plotted in dose bins at <30%, 30–60%, and >60%, respectively. Similarly, for V70 (Ahn et al. [11]), V50 (Rodriguez et al. [23]), and V60 (Kim et al. [20]), each symbol represents rates of acute esophagitis at <10% vs. 11–30% vs. 31–64%, and ≤30% vs. ≥30%, and ≤30 vs. >30%, respectively. Dashed horizontal lines reflect dose ranges ascribed to each data point. Upper x-axis range of greatest data point for V50 (Rodriguez et al. [23]), V50 (Ahn et al. [11]), and V60 (Kim et al. [20]), are indefinite according to data (light-gray dotted bars). Solid and open symbols represent reported rates of Grade 2 or greater acute esoph-agitis and Grade 3 or greater acute esophagitis, respectively. Thicker and thinner solid lines represent higher and lower doses of Vx, respectively (i.e., thicker line for V70 and thinner line for V20).