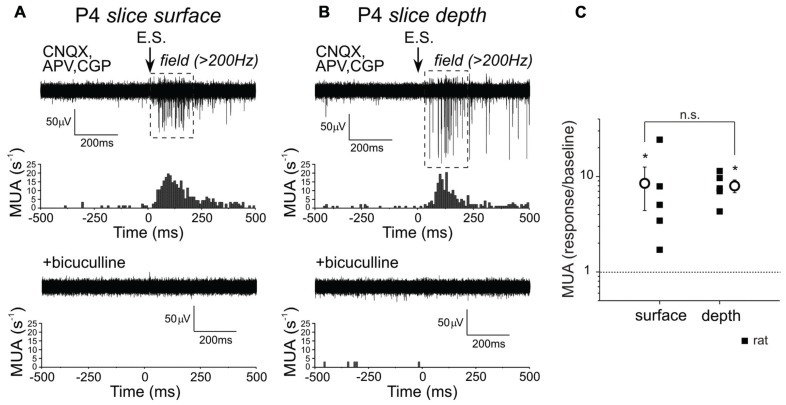
FIGURE 6.
Depth-dependence of MUA response on synaptic GABA(A) receptor activation in P4–5 rat hippocampal slices. (A,B) Example field potential recording of MUA response evoked by electrical stimulation (E.S.) at the surface (A) and in the core (B) of a P4 hippocampal slice in the presence of ionotropic glutamate and GABA(B) receptor antagonists (CNQX, APV, CGP55845). Suppression of MUA response by 20 μM bicuculline is shown at the bottom. Corresponding peristimulus spike time histograms normalized to 100 sweeps are shown below each trace. (C) Summary plot of electrically evoked MUA response, normalized to the baseline at the surface and depth of the slice. Squares reflect the normalized MUA response at the depth and the surface of an individual slice, circles show mean values ± SE.

