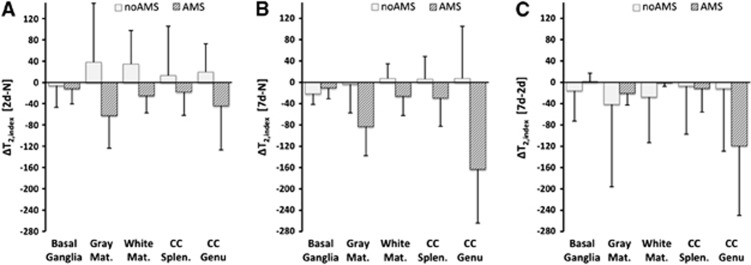
Figure 6.
Changes in T2,index for acute mountain sickness (AMS) and no-AMS groups for different cerebral regions (regions are same as Figure 3. Panels (A), (B), and (C) are same time periods as Figure 1). Broadly similar pattern in all regions except basal ganglia. The no-AMS group have increased T2,index at 2 days, which has returned to approximately normoxia apparent diffusion coefficient (ADC) levels by 7 days (A, B). The AMS group has reduced T2,index at 2 days and further reduction in T2,index at 7 days (A, B). Genu of the corpus callosum (CC Genu) shows especially large reductions in T2,index during 2-day to 7-day acclimatization period (C). In basal ganglia, the no-AMS group shows an initial decrease in T2,index at 2 days relative to normoxia (A). The AMS group shows an initial decrease in T2,index with no further reduction by 7 days. Error bar=1s.d. Significant differences in T2,index at both 2 days and 7 days hypoxia relative to normoxia (P<0.05, main effect of AMS), and between regions at 7 days (P<0.0005, main effect of region, and P<0.0001 AMS × region interaction).

