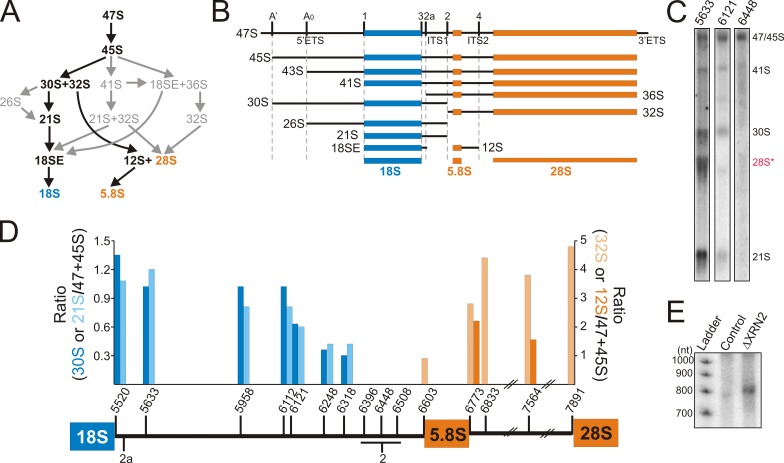
Figure 1.
Mapping the cleavages in human ITS1. (A) Alternative processing pathways of human rRNA, with the major pathway indicated in black. (B) Schematic representations of pre-rRNA intermediates, with the processing/cleavage sites, ETS and ITS, indicated. (C) HeLa cell RNA was separated by glyoxal/agarose gel electrophoresis, transferred to nylon membrane, and hybridized with a variety of ITS1/2 probes (indicated at the top of each lane). The RNAs detected are indicated on the right. Panels are reproduced in Fig. S1 A. (D) Ratios of the SSU (30S [dark blue] and 21S [light blue]) or LSU (32S [light orange] and 12S [dark orange]) precursors to the 45S/47S transcripts were calculated and plotted for each probe (x axis). A schematic representation of the region from the 3′ end of 18S rRNA to the 5′ end of 28S is shown. One set of data, which is representative of at least two experiments, is shown. (E) RNA was extracted from control HeLa cells and cells depleted of XRN2 by RNAi (indicated above each lane). Equal amounts of RNA were separated on an 8% acrylamide/7 M urea gel and analyzed by Northern blotting using the ITS1 6121 probe. “Ladder” indicates a 32P-labeled 100-bp ladder.

