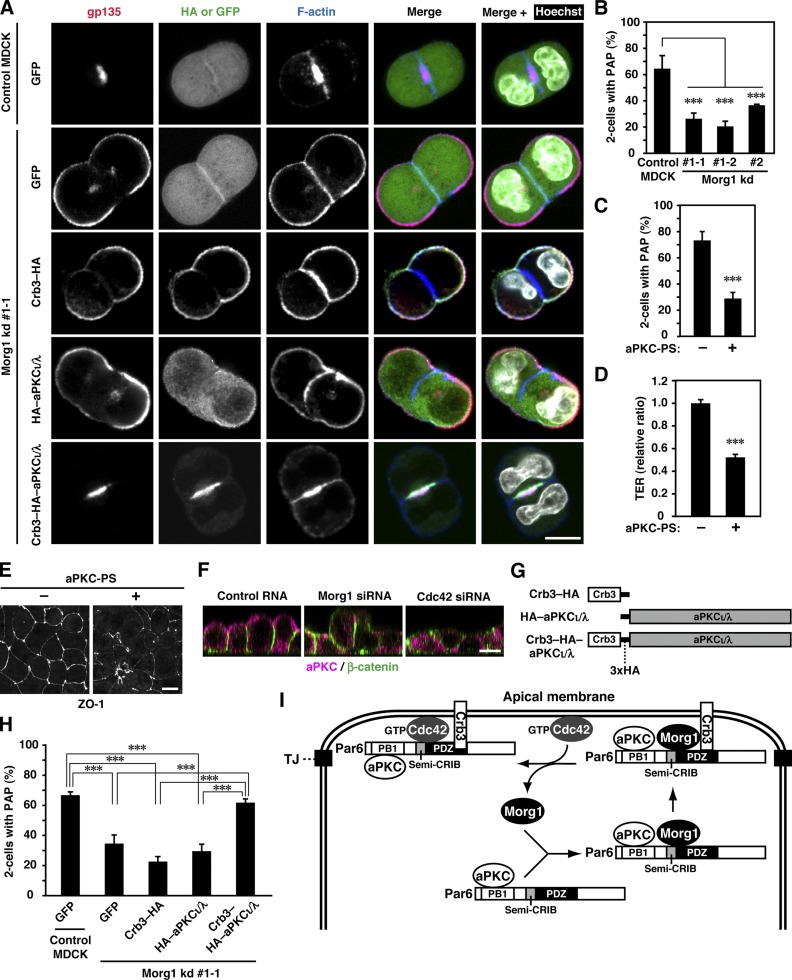
Figure 8.
Forced targeting of aPKC to the apical surface rescues apico-basal polarization in Morg1-depleted cells during cystogenesis. (A) Representative confocal images of Morg1 kd #1-1 cells expressing GFP, Crb3–HA, HA–aPKCι/λ, or Crb3–HA–aPKCι/λ in 3D culture. Cells were fixed and stained with the indicated antibodies. (B) Quantification of two-cell aggregates with PAP, a gp135-positive structure, in 3D culture of Morg1-depleted cells. Values are means ± SD from three independent experiments (n ≥ 75 aggregates/experiment). ***, P < 0.001 (Dunnett’s test). (C) Quantification of two-cell aggregates with PAP in 3D culture of MDCK cells treated with (+) or without (−) 40 µM of aPKC-PS. Values are means ± SD from three independent experiments (n ≥ 50 aggregates/experiment). ***, P < 0.001 (Student’s t test). (D) TER measurements of 2D monolayers of MDCK cells 8 h after the calcium switch (CS) in the presence of (+) or absence (−) of aPKC-PS. TER values of each sample were expressed as percentage of those of control cells. Values are means ± SD from three independent experiments. ***, P < 0.001 (Student’s t test). (E) Representative microscopy images of MDCK cells treated with (+) or without (−) aPKC-PS in 2D culture. Cells were fixed 4 h after CS and stained with the anti-ZO-1 antibody. (F) Cross-sectional z-stack analysis of representative confocal images of MDCK cells transfected with the indicated RNA in 2D culture. Cells were fixed 4 h after CS and stained with the indicated antibodies. (G) Schematic structure of aPKCι/λ-fusion proteins used in the present study. (H) Quantification of two-cell aggregates with PAP in 3D culture of Morg1 kd #1-1 cells expressing GFP, Crb3–HA, HA–aPKCι/λ, or Crb3–HA–aPKCι/λ. Values are means ± SD from three independent experiments (n ≥ 100 aggregates/experiment). ***, P < 0.001 (Tukey-Kramer test). (I) A proposed model for Morg1-mediated targeting of Par6–aPKC to the apical surface. For detail, see the text. Bar, 10 µm.

