Figure 1.
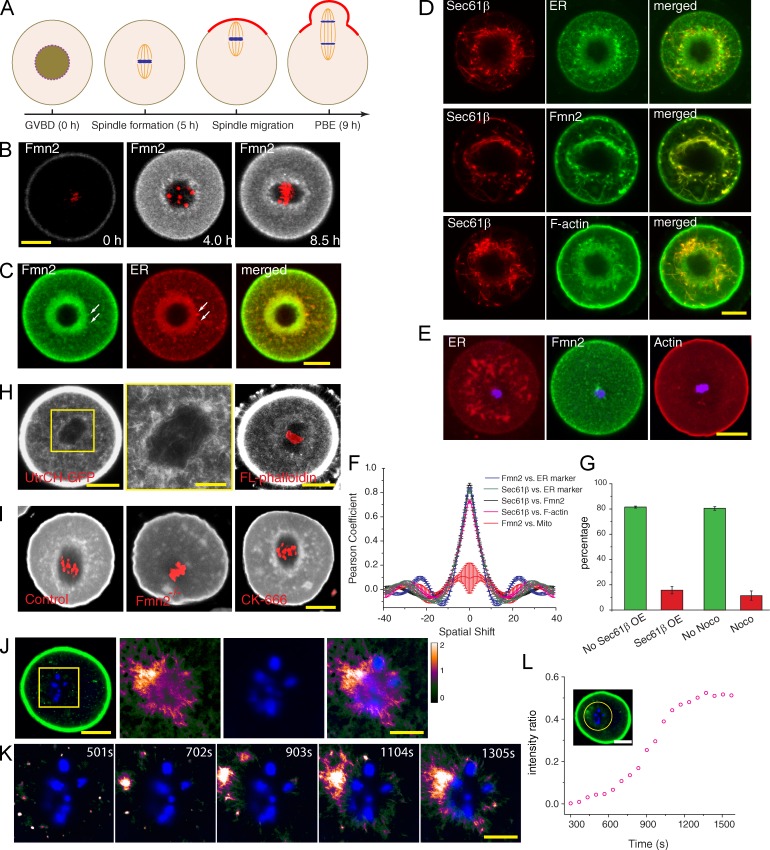
Fmn2 association with ER at spindle periphery and local actin polymerization. (A) Timeline of events in an unperturbed MI mouse oocyte. PBE, polar body extrusion. (B) Localization of Fmn2-AcGFP before and after GVBD (time stamps according to Video 1). Red, chromosomes. (C) Colocalization of Fmn2 with ER stained with blue-white DPX. Arrows point to some distinct structures with colocalization. (D) Overexpression of Sec61-β–mKate2 induces ER tubularization and accumulation of Fmn2 and F-actin along tubular ER. (E) Nocodazole treatment at GVBD + 0.5 h abolished normal Fmn2 distribution and actin enrichment around the chromosomes. (F) Plots of SEM and mean Pearson coefficient (n = 3) as a function of spatial shift in units of micrometers from spatial correlation analysis. (G) Percentage (mean and SEM from three experiments) of oocytes succeeded in chromosome migration when overexpressing Sec61-β–mKate2 (as in D; no Sec61-β overexpression [OE], n = 57; Sec61-β overexpression, n = 71) or treated with nocodazole at GVBD + 0.5 h to block ER congregation (as in E; no nocodazole [Noco], n = 59; nocodazole, n = 65). P < 0.005. (H) F-actin in the MI oocyte (GVBD + 6 h) visualized by strong expression of UtrCH-GFP (left) or microinjection of trace fluorescent phalloidin (right). A magnified view of the boxed region on the left is shown in the middle. (I) Staining of fixed oocytes (GVBD + 6 h) with Alexa Fluor 633–labeled phalloidin. (J) Right three images are time projections of a difference video with chromatin staining (blue) from the box of the UtrCH-GFP image on the left. (K) Montage of new F-actin growth near chromosomes after cytochalasin D washout. Full view is shown in Fig. S1 J. (L) Increase of intensity ratio of chromosome region (circled area; the data shown are from a representative video shown in Fig. S1 J, n = 5). Bars: (B–E, H [left and right], I, J [left], and L) 20 µm; (H [middle], J [right], and K) 10 µm.

