Figure 2.
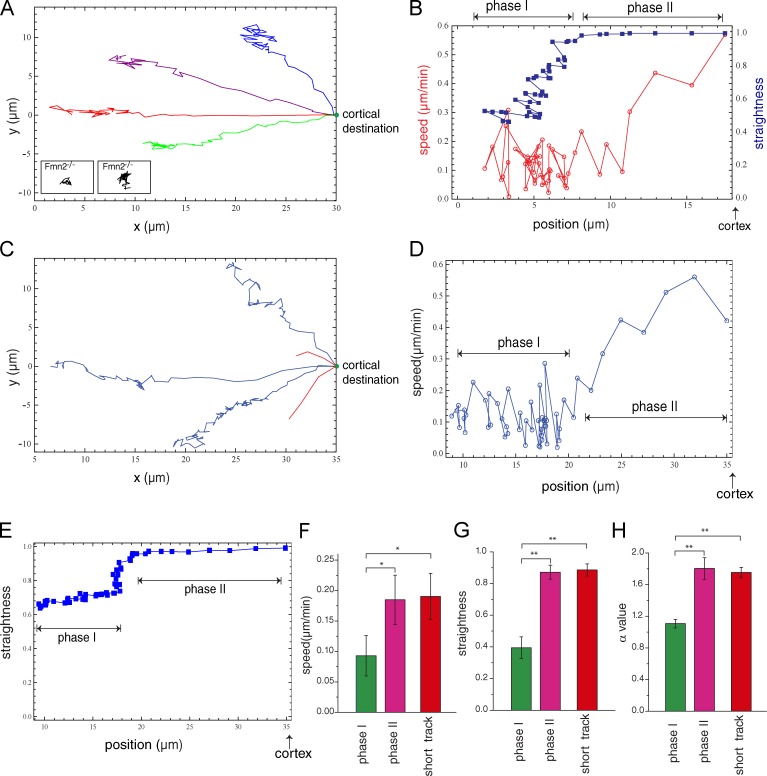
MI spindle/chromosomes migrate in a biphasic manner. (A) Trajectories of chromosome migration with intact spindle in wild-type oocytes (examples from 11 oocytes analyzed). Insets show two example trajectories of chromosome migration in Fmn2−/− oocytes at the same spatial scale. (B) Speed and straightness as a function of the chromosome position along the axis connecting the initial and end positions of migration corresponding to a trajectory shown in A. “Cortex” refers to the chromosome position when the spindle contacts the cortex. (C) Trajectories of chromosome migration after spindle disassembly from an initial position near the cell center (blue traces) or near the cortex (red traces). Examples are from 12 oocytes analyzed. (D and E) Speed (D) and straightness (E) as a function of the chromosome position of a blue trajectory shown in C. (F–H) Quantification of speed (F), straightness (G), and α value of the MSD analysis (H) of trajectories from a near-center or off-center (short track) initial position (n = 5). Histograms show means and SEM. *, P < 0.05; **, P < 0.005.

