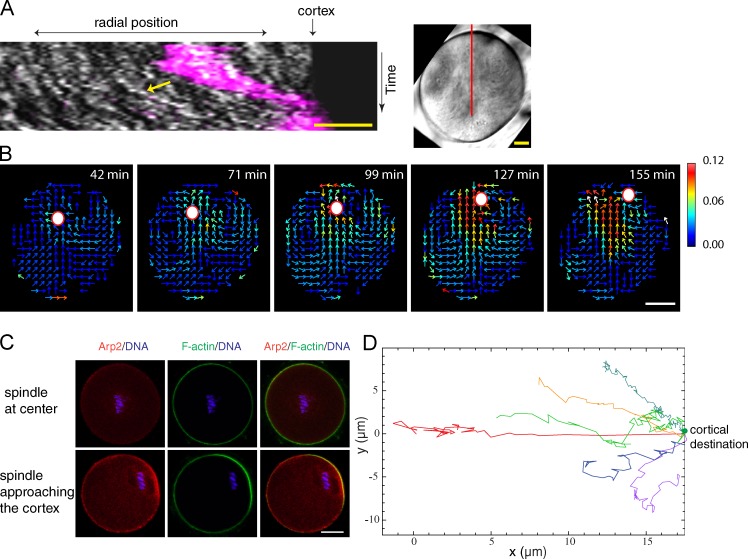
Figure 4.
Fast migration phase depends on the Arp2/3 complex and cytoplasmic streaming. (A) Kymograph (left) along the red line shown in the right image (a time projected image from a transmitted light video). Chromosomes are shown in magenta; cytoplasmic particles are shown in white (yellow arrow). (B) Montages of vector maps of cytoplasmic streaming. The heat bar unit is given in micrometers per minute. (C) Localization of Arp2/3 complex by anti-Arp2 immunostaining. (D) Chromosome trajectories in a control (red) or CK-666–treated oocytes in which the chromosomes moved to the cortex (all other colors). Examples are from 15 oocytes analyzed. Bars: (A) 10 µm; (B and C) 20 µm.

