Figure 4.
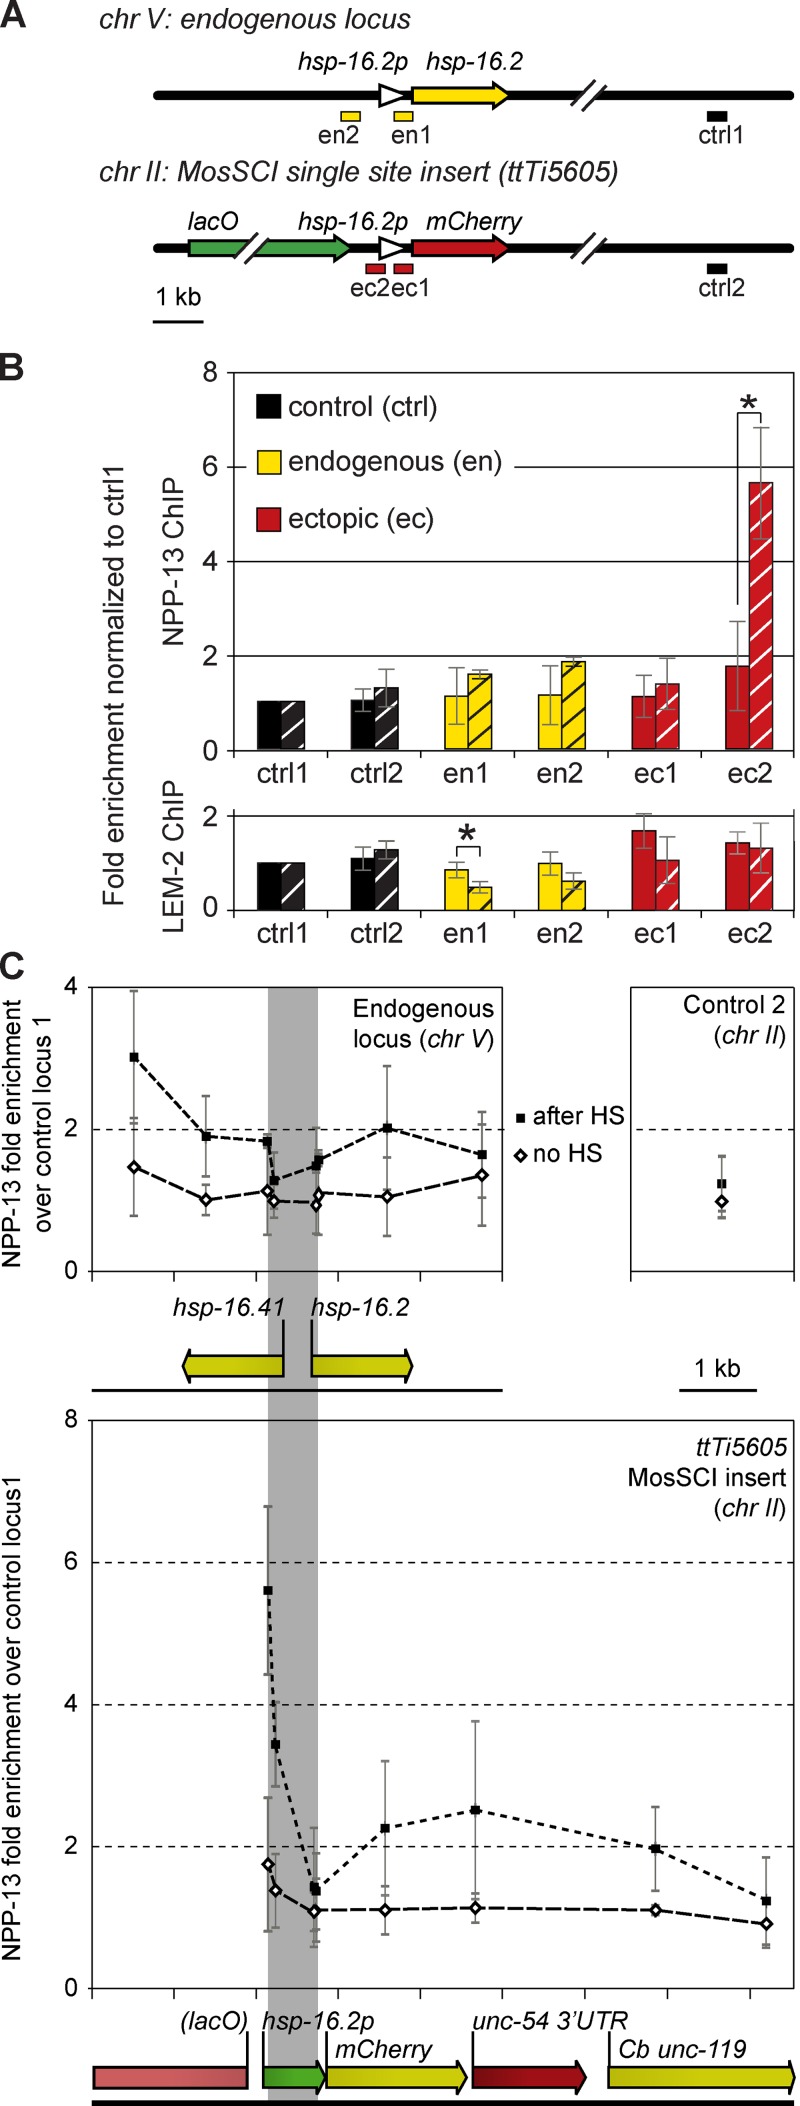
NPC interaction at endogenous hsp-16.2 and at the MosSCI–hsp-16.2 promoter insert increases after HS. (A) Sketch of the endogenous hsp-16.2 locus (top, chr V) and the ectopic MosSCI insert (bottom, chr II) of hsp-16.2::mCherry at ttTi5605, showing probes used for qPCR (en1 and -2, endogenous; ec1 and -2, MosSCI insert). Probes en1, en2, and ec1 are near TSS; control loci ctrl1 and ctrl2 do not to interact with NPC or LMN-1. crtl1 is used for normalization and ctrl2 is not HS-inducible. All ChIP was performed in triplicate on a single strain; see Materials and methods for quantitation. (B) NPP-13 (top) and LEM-2 (bottom) ChIP enrichment of the probes in A, normalized to ctrl1. Values are shown before (unhatched) and 10 min after (hatched) HS. Asterisks indicate statistically significant change. (C) Additional qPCR probes were used to monitor ChIP enrichment at the endogenous hsp-16.2 and MosSCI hsp-16.2 promoter integration, before (Δ) and after HS (▪). Loci are aligned (gray column). ctrl2 normalized to ctrl1 reflects no HS response. Error bars indicate mean ± SEM.

