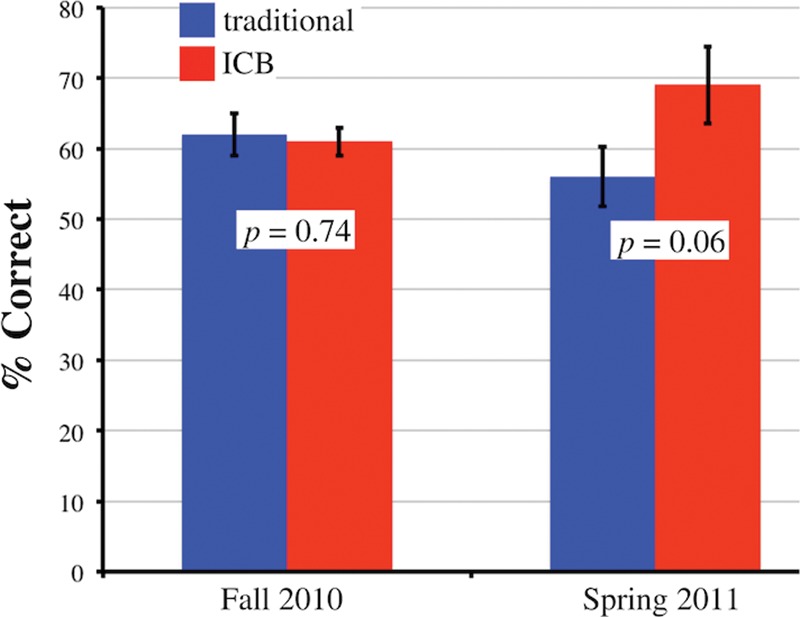
Figure 3.

Content knowledge testing. In the Fall of 2010, students in all three sections answered 16 multiple-choice questions as part of graded tests. In April 2011, the same students were asked a subset of the same questions. Percent correct is the average of student scores. Error bars represent SE of the mean.
