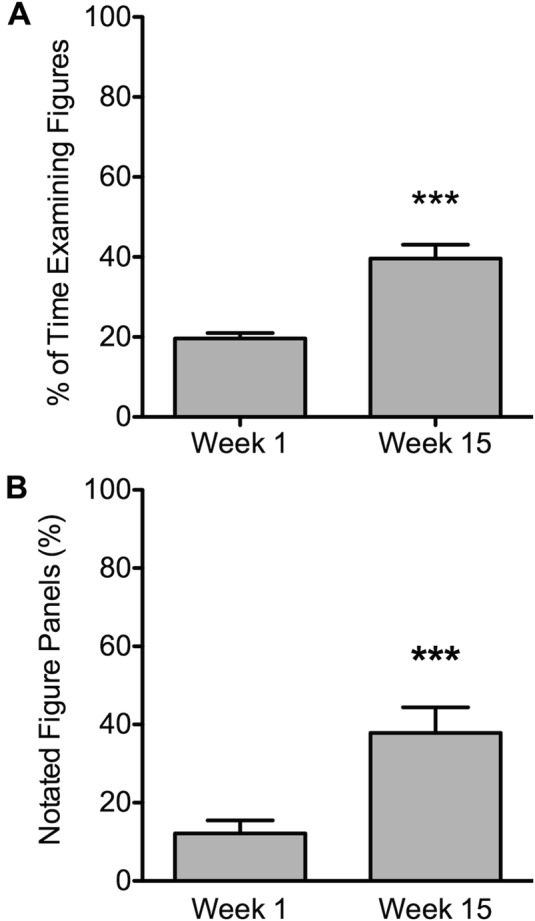
Figure 2.

Students spent more time examining data figures after using Figure Facts for 15 weeks. (A) In weeks 1 and 15, students recorded the amount of time they spent reading the text of a primary research article vs. examining the data figures. (B) The number of notations made in the margins of each figure panel was also recorded at weeks 1 and 15. Error bars, SEM; ***, p < 0.001 by paired t test; week 1: n = 14; week 15: n = 16. Two students were omitted from the week 1 analysis due to incorrect completion of the assessment.
