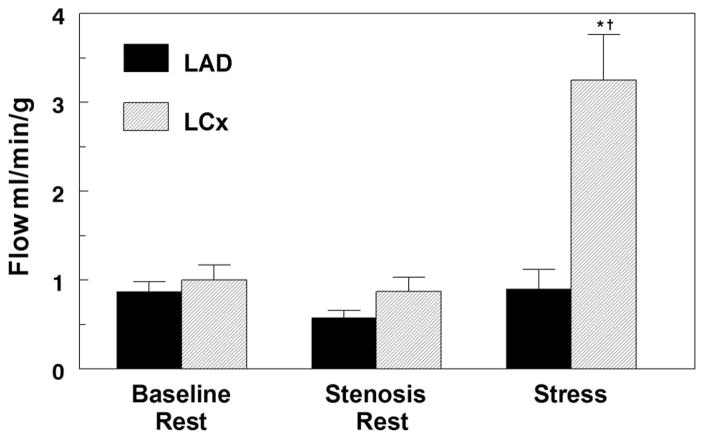
Figure 2.
Average transmural myocardial blood flow in the LAD and left circumflex (LCx) territories determined using microsphere injections at baseline, after setting the critical LAD stenosis, and during peak vasodilator stress at 123I-ZIROT injection. * P<0.001 vs baseline, and †P<0.001 vs LAD. n=5.

