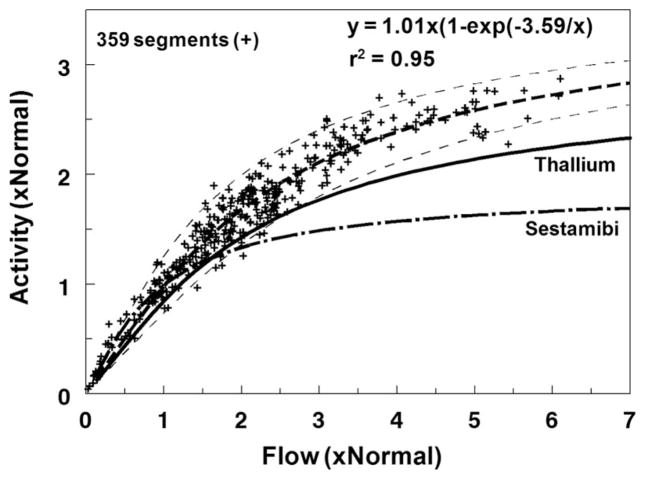
Figure 3.
Flow-extraction relationship. This graphic represents the pooled results from 359 myocardial segments obtained from the 5 experiments. 123I-ZIROT activity and flow in each myocardial segment were normalized to the area of normal flow (≈1 mL/[min · g]). The curve fit through the experimental data were of the form y=a0*(1−exp[−a1/x]) according to the kinetic transport model of Gosselin and Stibitz.24 The results previously obtained in our laboratory using the same animal model for thallium-201 and 99mTc-sestamibi are represented on the same graphic.6 r2 is the coefficient of determination.

