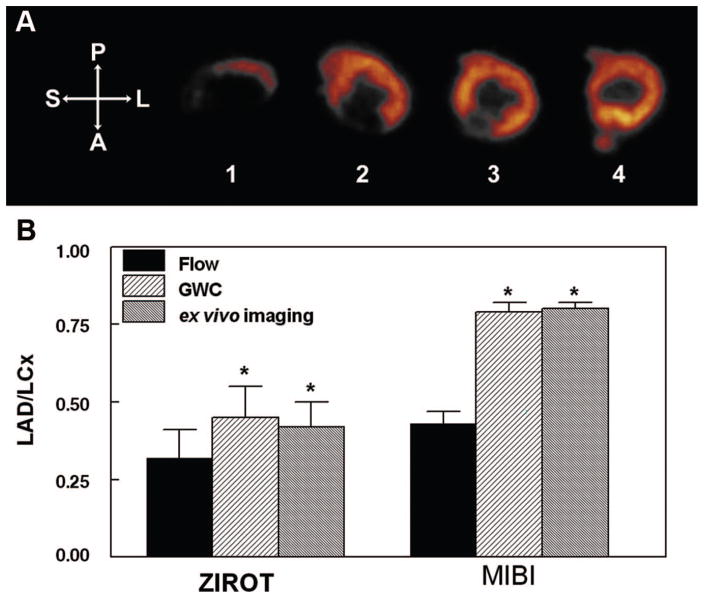
Figure 4.
A, Representative example of 123I-ZIROT ex vivo imaging. Note the presence of a large defect on the anteroseptal segments of the most apical short-axis slices (slices 1–3). The defect:normal count ratio in this dog was 0.20. B, Comparison between the average transmural flow defect magnitude and the average 123I-ZIROT defect magnitude, as determined by GWC (γ well counting) or ex vivo imaging (n=5). For comparison, our previous results using the same animal model for 99mTc-sestamibi with comparable flow at injection are represented on the same graphic (n=9).6 *P<0.05 vs flow ratio. P indicates posterior; A, anterior; S, septal; L, lateral.

