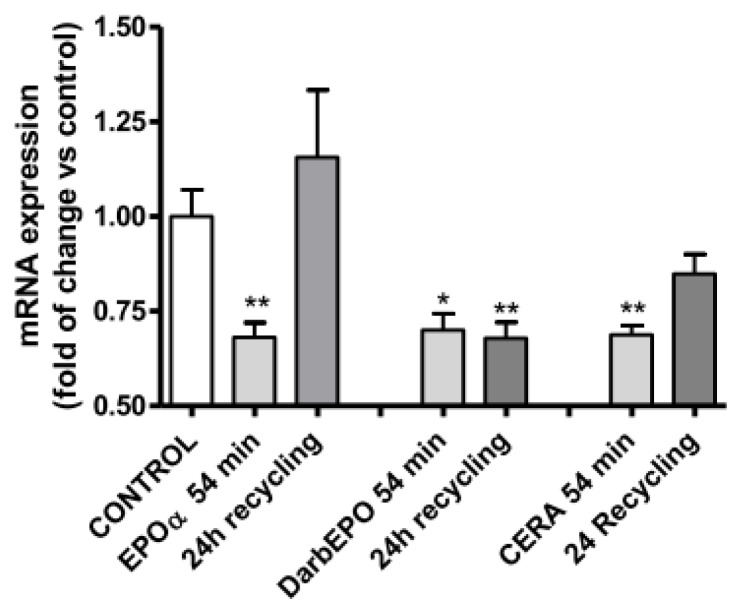
Figure 10.
Effect of EPOR desensitization/resensitization on EPOR mRNA expression levels. The cells were pre-treated with medium alone (control) or 1 IU/mL EPOα, 1 IU/mL DarbEPO or 5 IU/mL CERA for 54 min and then washed-out for 24 h. RT-PCR for the EPOR gene was performed, and β-actin used as the house-keeping gene. The data are expressed as the fold mRNA EPOR changes vs. control. *p < 0.05, **p < 0.01 vs. control cells.

