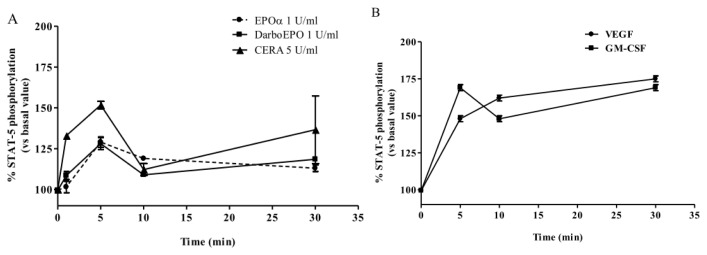
Figure 3.
Time-dependence of EPOα-, DarbEPO- and CERA-mediated STAT-5 phosphorylation. HUVECs were treated with medium alone (control) or 1 IU/mL EPOα, 1 IU/mL DarbEPO or 5 IU/mL CERA for different periods of time ranging from 5 to 30 min (A). Aliquots of cells were treated with VEGF (25 ng/mL) or granulocyte-macrophage colony-stimulating factor (GM-CSF) (10 IU/mL) for the same time intervals as above (B). STAT-5 phosphorylation levels were quantified using an ELISA kit (see Materials and Methods). The data are expressed as the percent STAT-5 phosphorylation compared to the untreated control cells (set to 100%) and represent the mean ± SEM of three different experiments.

