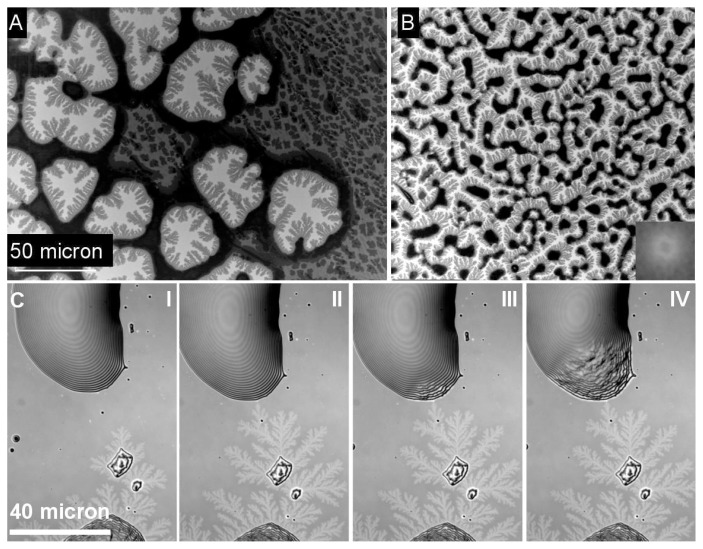
Figure 3.
Heterogeneous (A) or spinodal dewetting (B) morphologies (SEM micrographs) The inset in Figure 3B refers to the Fast Fourier Transform (FFT) Calculation of the structure typical for spinodal dewetting. Dendritic growth in ultrathin layers between individual PEO droplets (C I-IV). (Contrast enhanced light microscopic images), identical scale bar for A, B and C I-IV.

