Figure 2.
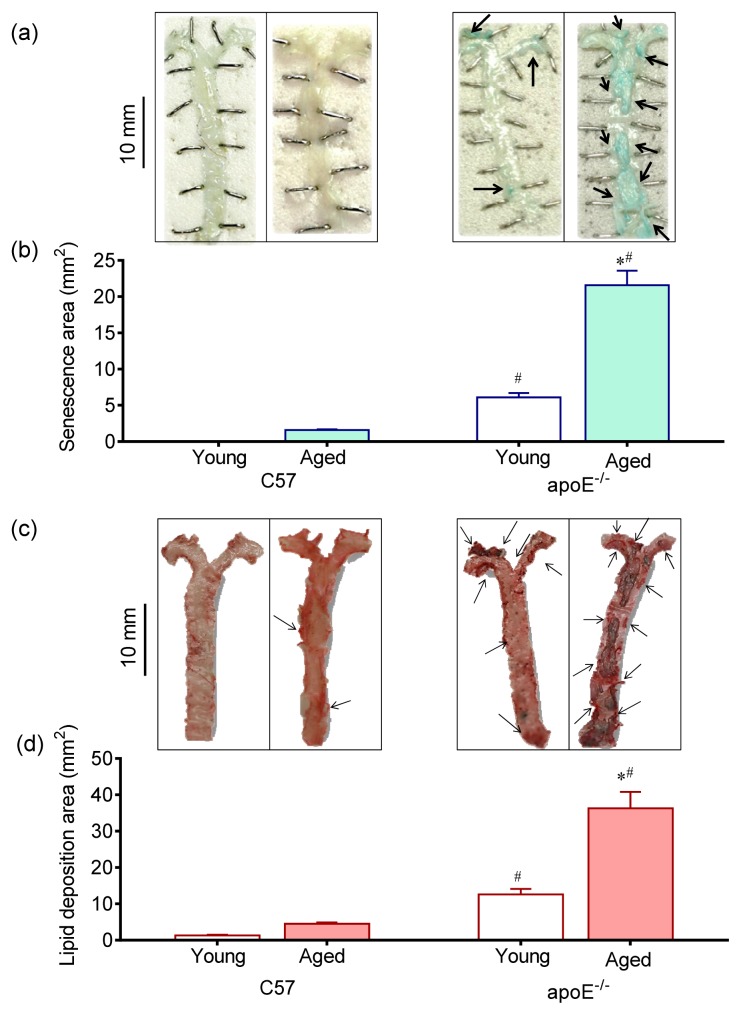
Vascular lipid deposition and senescence. Representative aorta en face macrographs of (a) senescence (X-gal, pH 6.0) and (c) lipid deposition (Oil-Red-O staining) in young and aged C57 mice compared with age-matched apoE−/− mice. A remarkable large area of vascular senescence and lipid deposition was observed in aged apoE−/− mice. Bar graphs show average vascular senescence (b) and lipid deposition (d) areas. The values are presented as means ± SEM. * p < 0.05 vs. the respective young group, #p < 0.05 vs. the age-matched C57 group.

