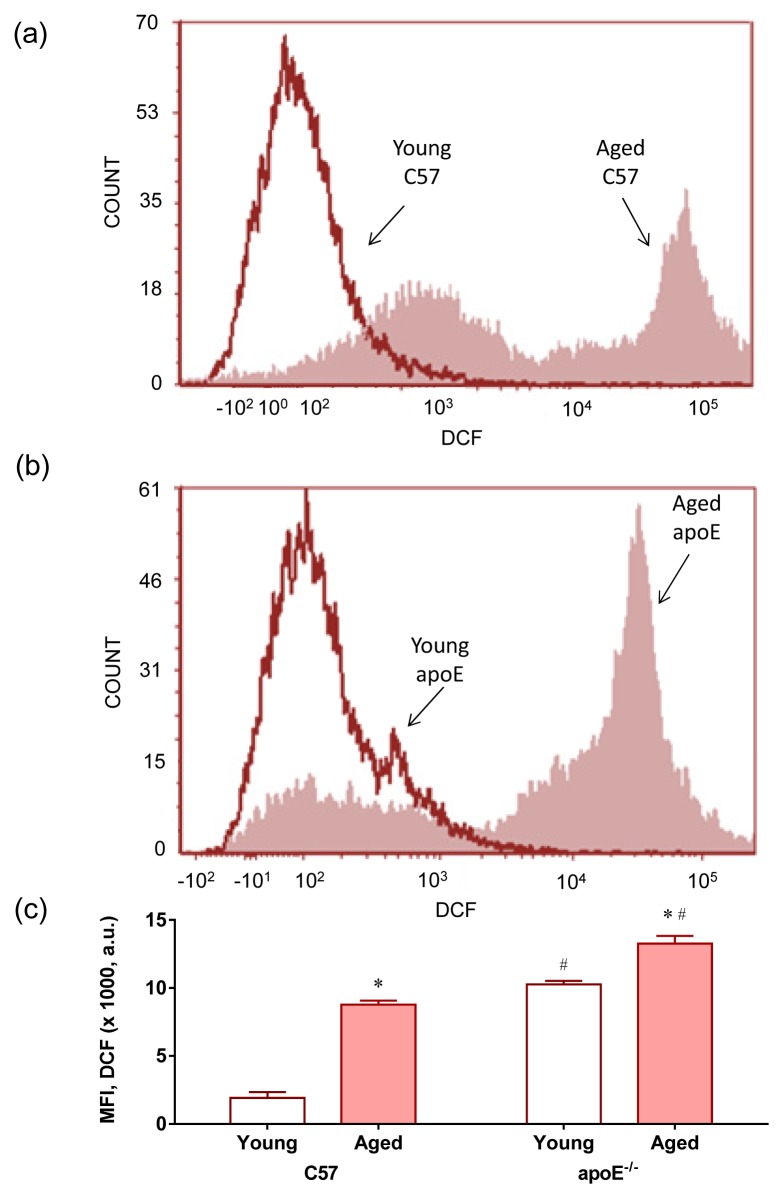
Figure 4.
Production of hydrogen peroxide. Representative histogram from flow cytometric analysis with 2′,7′-dichlorofluorescein (DCF) in young and aged C57 mice (a) compared with age-matched apoE−/− mice (b); the log fluorescence (X-axis) illustrates the intensity of fluorescence for the number of cells counted (note the higher scales in the apoE−/− histogram). Increased levels of hydrogen peroxide were observed in aged mice mainly in apoE−/− mice; (c) Bar graph showing mean fluorescence intensity (MFI). The values are presented as the means ± SEM. * p < 0.05 vs. the respective young group, #p < 0.05 vs. the age-matched C57 group.

