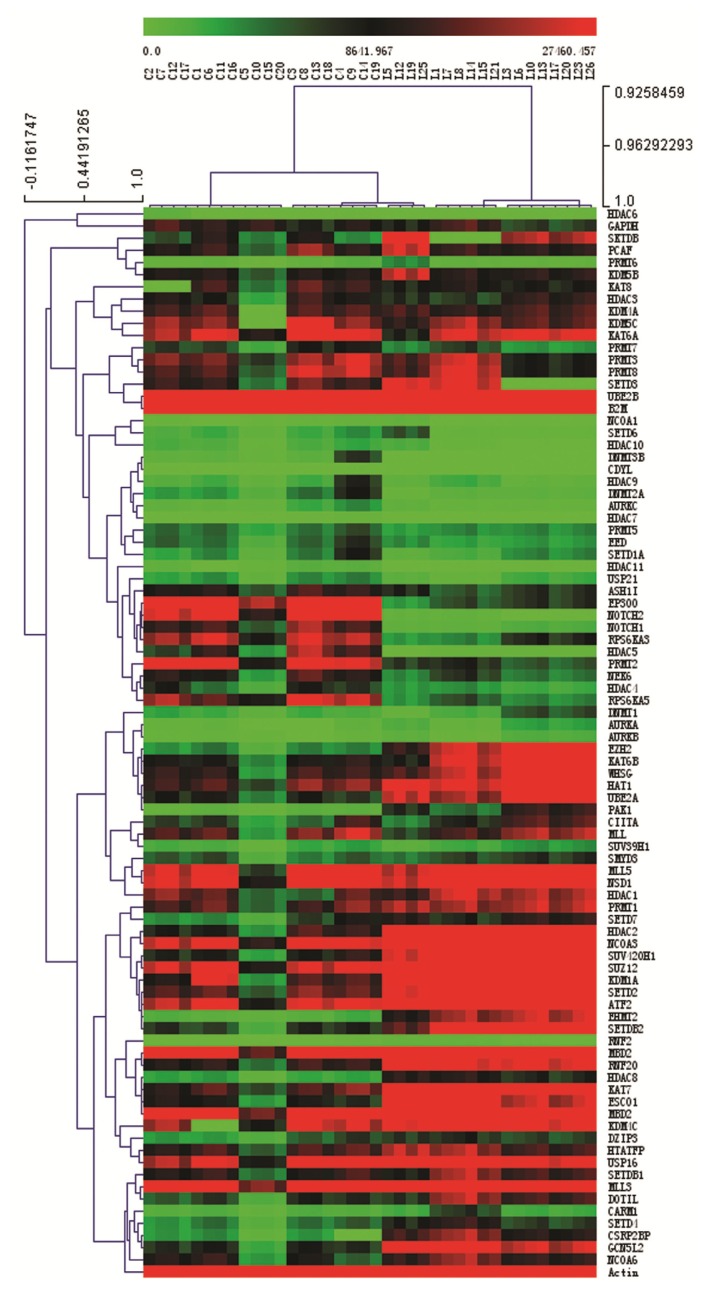
Figure 2.
Expression and clustering analysis of differentially expressed genes encoding epigenetic chromatin modification enzymes in pediatric ALL and normal control samples. Clustering analysis of the gene expression data from the real-time PCR array. The comparative Ct method was used for quantification of gene expression. The gene expression levels for each target gene were normalized to the housekeeping gene GAPDH within the same sample (−ΔCt); then the relative expression of each gene (n = 87) was calculated using 106 × Log2(−ΔCt). Gene expression in the normal karyotype B cell pediatric acute lymphoblastic leukemia (ALL) (n = 18) and control samples (n = 20) was analyzed using Multi Experiment View (MEV) clustering software.

