Figure 6.
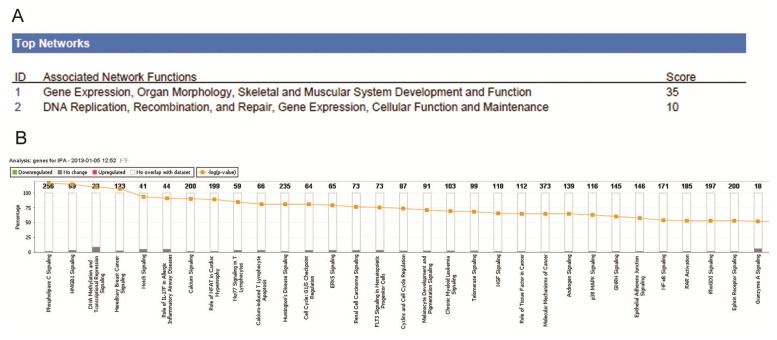
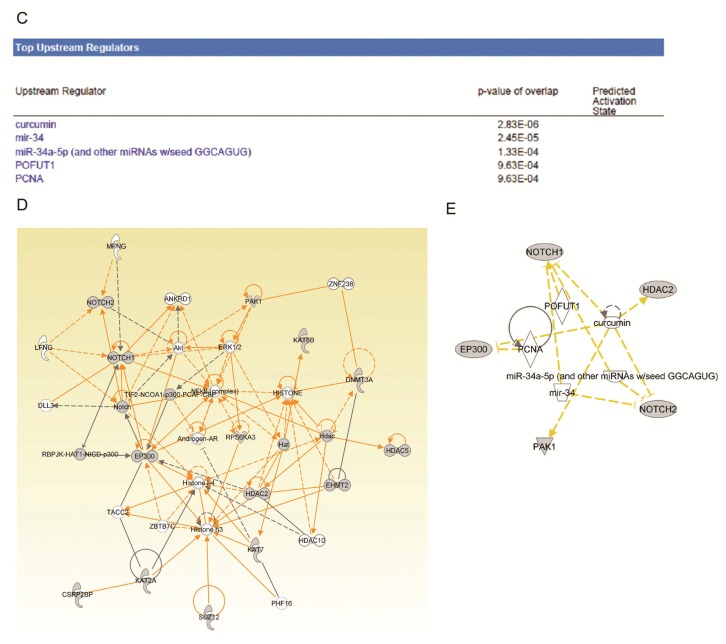
Summary of Ingenuity Pathway Analysis for dys-regulated epigenetic chromatin modification genes in normal karyotype B cell pediatric ALL. To investigate possible interactions between the differently regulated genes in pediatric ALL, datasets representing the 18 significantly altered genes were imported into the Ingenuity Pathway Analysis (IPA) Tool. (A) Top two networks obtained from IPA (with their respective scores) for the differently regulated genes in pediatric ALL; (B) Toxicology pathway list obtained from IPA analysis for the differently regulated genes in pediatric ALL. The x-axis represents the most significant toxicology functions based on the differentially expressed genes are highlighted; the y-axis represents the number of genes from the dataset that map to the pathway and the number of all known genes ascribed to the pathway. The yellow line represents the threshold p value (0.05), as calculated by Fisher’s test; (C) Upstream regulator list for the differently regulated genes in pediatric ALL. Curcumin and mir-34 were the two most significant upstream regulators of the differently regulated genes in pediatric ALL; (D) Network representation of the most highly rated network for the differently regulated genes in pediatric ALL. The shaded genes are statistically significant. Solid lines represent a direct interaction between two gene products, dotted lines represent indirect interactions; (E) Mapping of the genes associated with the upstream regulators for the differently regulated genes in pediatric ALL.


