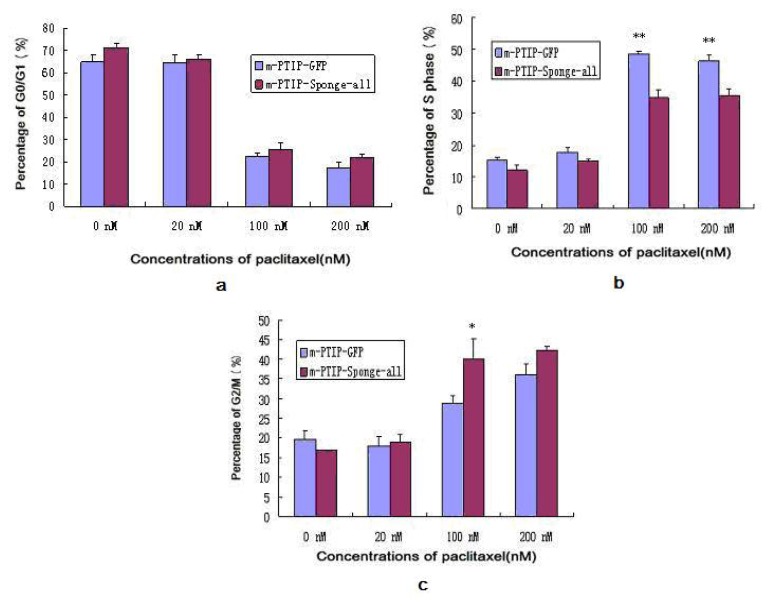
Figure 5.
Results of Cell Cycle of SKOV3-TR30 after transduction. (a) The Proportion of G0/G1 Phase; (b) The Proportion of S Phase; (c) The Proportion of G2/M Phase (* respects the group transduced by m-PTIP-Sponge all inhibit plasmid vs. the group transduced by m-PTIP-GFP empty plasmid in the same concentration of paclitaxel, p < 0.05; ** respects the group transduced by m-PTIP-Sponge all inhibit plasmid vs. the group transduced by m-PTIP-GFP empty plasmid in the same concentration of paclitaxel, p < 0.01).

