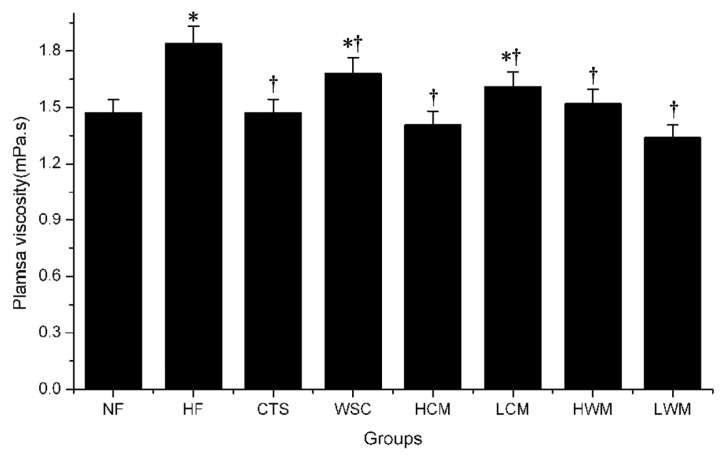
Figure 6.
Effects of CTS and WSC microspheres on plasma viscosity in rats fed with high-fat diets. Results are expressed as the mean ± SE of eight rats. *p < 0.05, significantly different when compared with rats fed with a normal diet; †p < 0.05, significantly different when compared with rats fed with a high-fat diet.

