Figure 3.
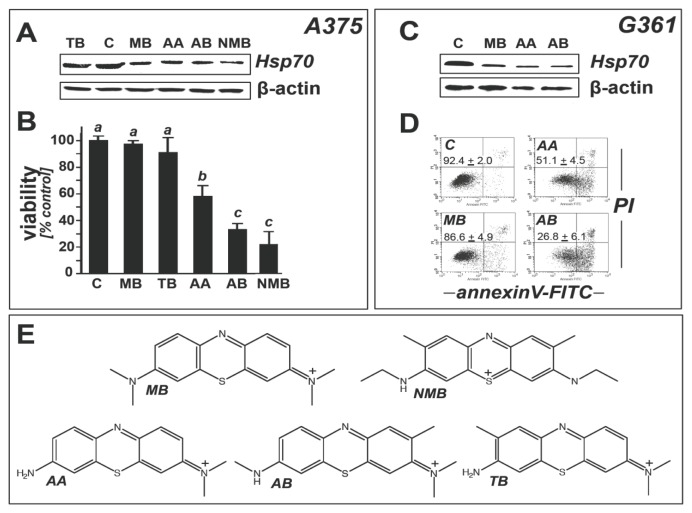
Comparative activity of phenothiazine-derivatives on melanoma cell viability and Hsp70 expression. (A) Hsp70 modulation as assessed by immunoblot analysis in A375 melanoma cells exposed to phenothiazine derivatives (10 μM, 24 h; methylene blue (MB), toluidine blue (TB), azure A (AA), azure B (AB), “new methylene blue” (NMB)) as assessed by immunoblot analysis. β-actin: loading control; (B) Viability analysis by flow cytometric analysis (all test compounds as used in (A)); (C) Hsp70 modulation as assessed by immunoblot analysis in G361 melanoma cells exposed to phenothioazine derivatives as specified in (A); (D) Viability analysis of G361 melanoma cells by flow cytometric analysis showing annexinV-PI panels; test compounds as used in (A); The numbers indicate viable (AV-negative, PI-negative) in percent of total gated cells (mean ± SD, n = 3). (E) Molecular structures of phenothiazine test compounds; abbreviations as in (A).

