
Fig 4.
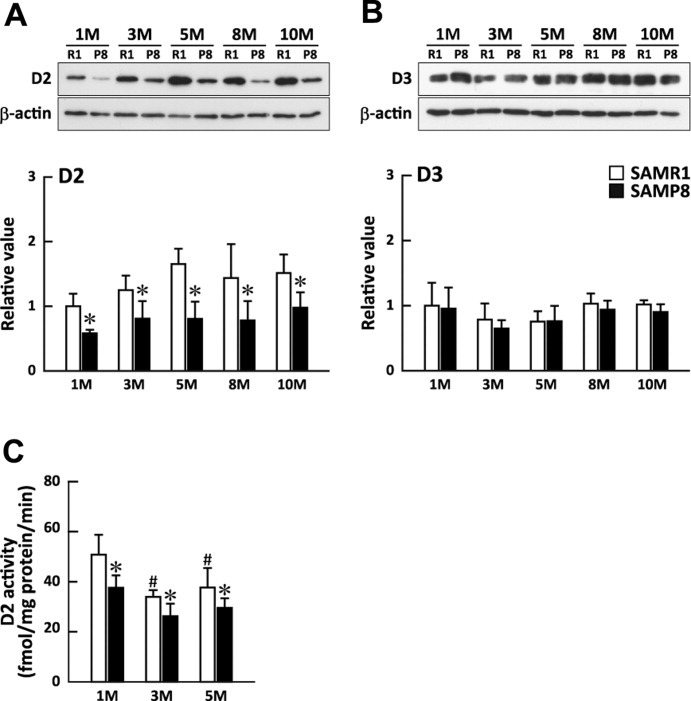
D2 and D3 protein levels and D2 activity in the hippocampus of SAMP8 and SAMR1 at different ages. D2 (A) and D3 (B) protein levels quantified by Western blotting with anti-D2 and anti-D3 antibodies, respectively. Immunoreactive bands of D2 and D3 (examples shown in upper panels) in the hippocampus of SAMP8 (solid bars) and SAMR1 (open bars) at different ages were quantified using β-actin as standard and expressed relative to that of SAMR1 at 1 month. Results are expressed as means + SD [n = 6–8 (SAMR1), n = 5–6 (SAMP8)]. *P < 0.05 between age-matched SAMP8 vs. SAMR1. C: D2 enzyme activity in the hippocampus of SAMP8 (solid bars) and SAMR1 (open bars) at 1, 3, and 5 months expressed as means ± SD [n = 6 (SAMR1), n = 5–6 (SAMP8)]. *P < 0.05 between age-matched SAMP8 and SAMR1. #P < 0.05 compared with the value at 1 month of the same strain.