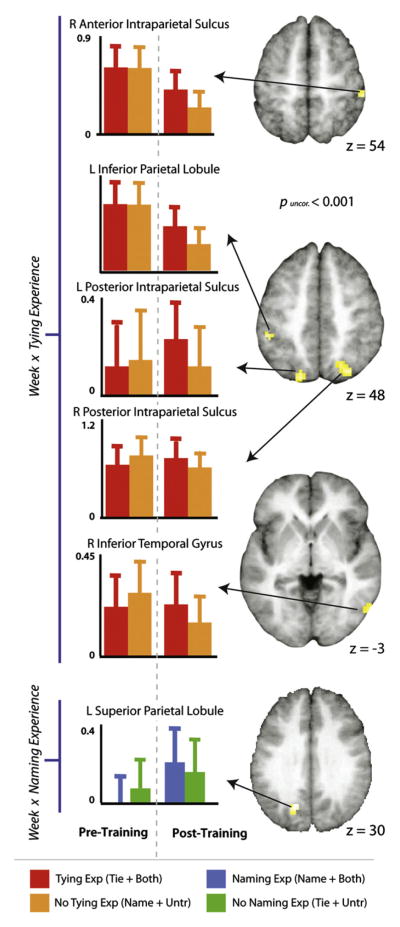
Fig. 6.
Imaging results illustrating the interaction between training experience and scanning session. The top three brains and five plots illustrate regions more responsive when perceiving knots that participants gained tying experience with (in the tying training condition and in the both tying and naming training condition), compared to those knots for which participants had no tying experience (knots in the name only and the untrained categories). The bottom brain and plot illustrates the region more responsive when perceiving knots participants had associated some kind of name with (from the naming training condition and the both naming and tying training condition), compared to knots for which participants had learned not naming information (knots in the tie only and the untrained categories). t-Maps are thresholded at t>3.48, puncorr. <0.001, and survived a small volume correction interrogating only those voxels that were more responsive when viewing knots than scrambled images during the pre-training scan (see Section 2). Parameter estimates were extracted from each cluster from both the pre-training and post-training scan sessions and are plotted to the left of the t-maps for illustration purposes only.

