
Figure 2.
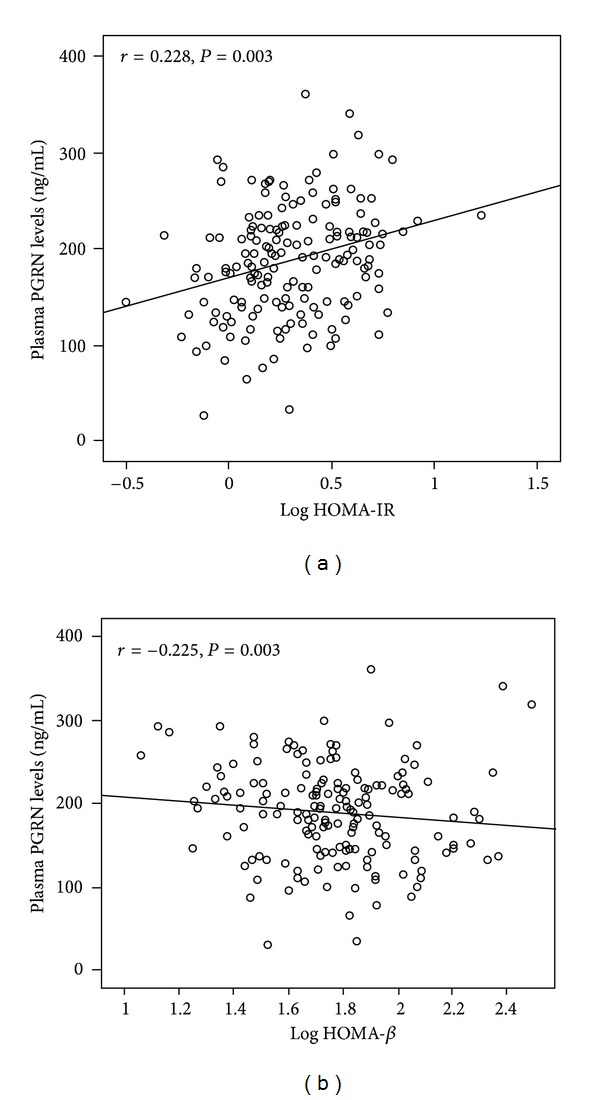
Scatter plots showing the correlation of plasma PGRN levels with HOMA-IR and HOMA-β in all subjects. (a) The plasma PGRN levels positively correlated with HOMA-IR. (b) The plasma PGRN levels negatively correlated with HOMA-β.
Official websites use .gov
A
.gov website belongs to an official
government organization in the United States.
Secure .gov websites use HTTPS
A lock (
) or https:// means you've safely
connected to the .gov website. Share sensitive
information only on official, secure websites.
Scatter plots showing the correlation of plasma PGRN levels with HOMA-IR and HOMA-β in all subjects. (a) The plasma PGRN levels positively correlated with HOMA-IR. (b) The plasma PGRN levels negatively correlated with HOMA-β.