
Figure 1.
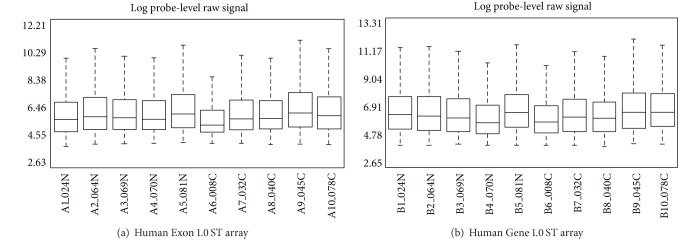
Distribution (boxplot) of the probe-level raw signal derived from (a) the Human Exon 1.0 ST array and (b) the Human Gene 1.0 ST. The raw signal distribution of each sample is similar across two platforms; for example, sample no. 6 has the lowest signal intensity distribution.