
Figure 2.
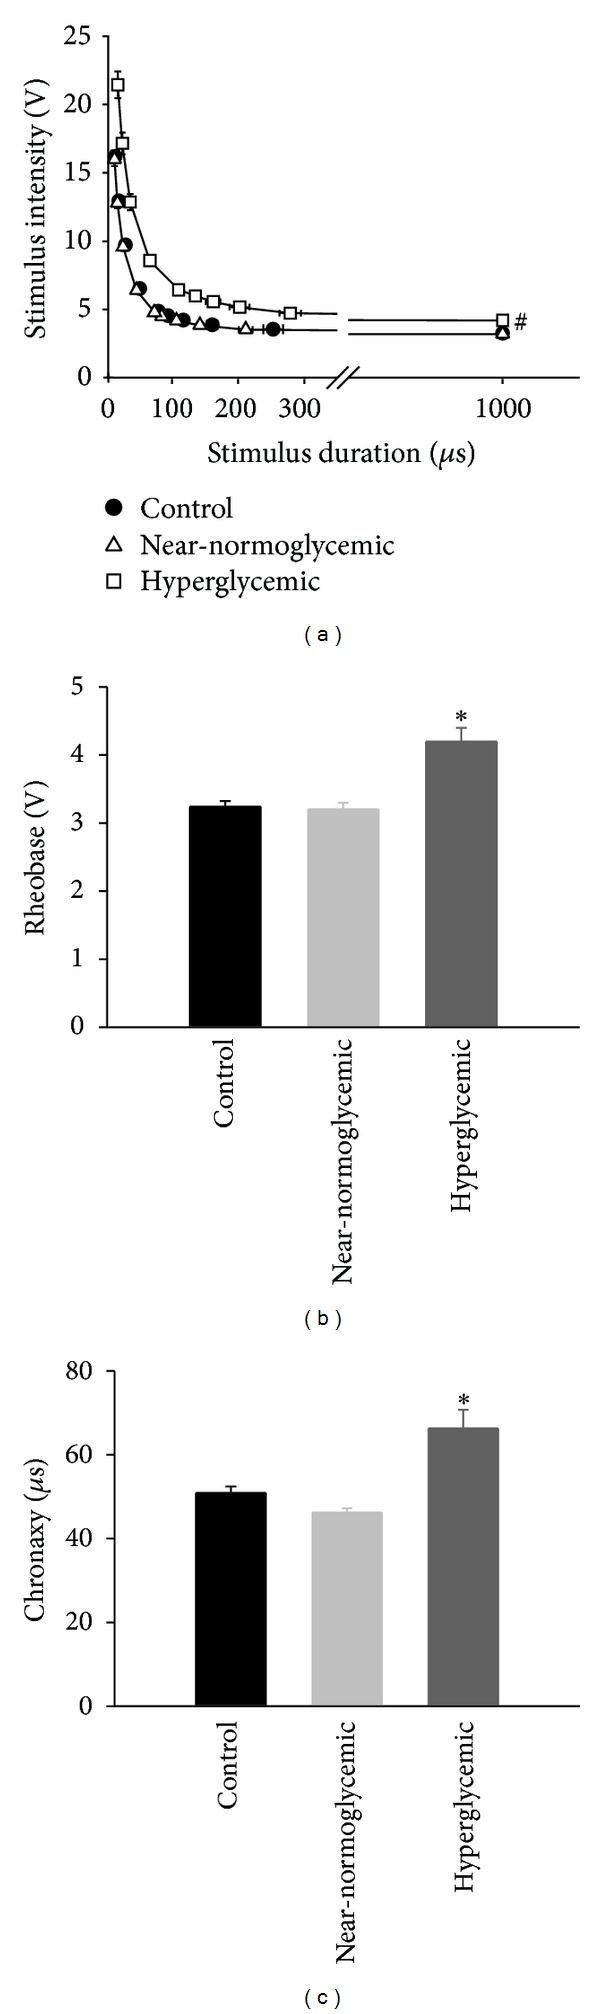
Strength-duration curves and parameters related to excitability of control (n = 13), near-normoglycemic (n = 14), and hyperglycemic (n = 9) groups. Stimulus intensity versus stimulus duration is illustrated in (a), and the two parameters related to excitability, rheobase and chronaxy, are shown in (b) and (c), respectively. The ∗ symbol indicates statistical difference related to control (P < 0.05, ANOVA followed by Holm-Sidak comparisons test), and # symbol indicates statistical difference between curves (P < 0.05, two-way ANOVA followed by Holm-Sidak multiple comparison test).