
Figure 3. pDC Impact on Nonspecific and Specific NK Cell Activation during MCMV Infection.
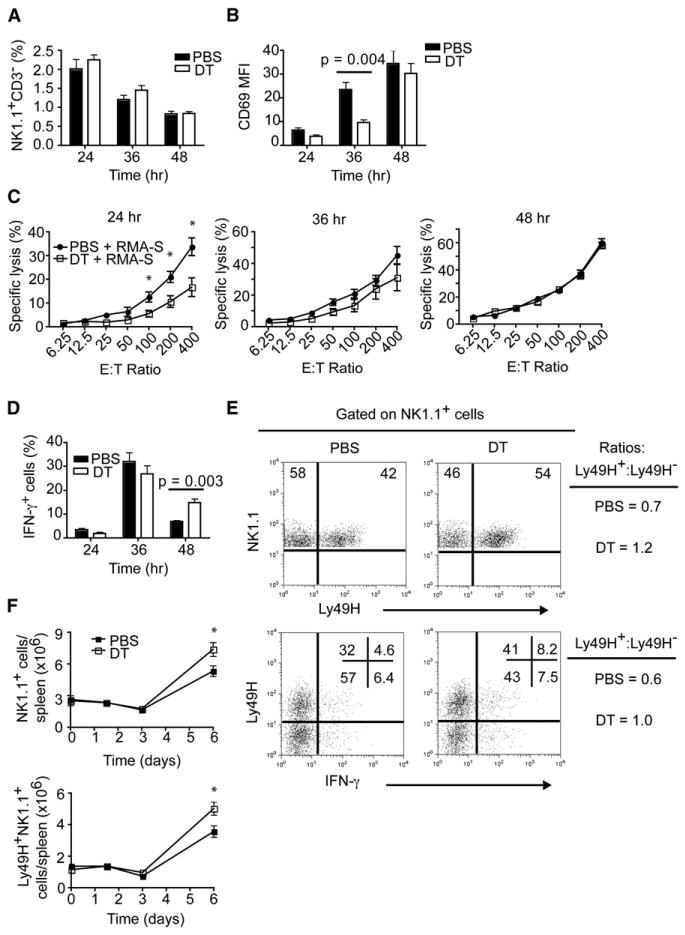
Mice were infected i.p. with MCMV (5 × 10⁴ pfu).
(A) Frequencies of NK cells (NK1.1+CD3−) in spleens.
(B) Expression of CD69 on splenic NK cells.
(C) Cytotoxic capacity of splenic NK cells from control and pDC-depleted mice with RMA-S target cells in standard 4 hr 51Cr release assays.
(D) Frequencies of IFN-γ+ NK cells in spleens of MCMV-infected mice.
(E) Frequencies of Ly49H+ and IFN-γ+-producing NK cells on day 3 p.i. Data are representative of six to eight mice from two experiments.
(F) Total numbers of NK1.1+ and Ly49H+NK1.1+ cells during MCMV infection.
(B and D) p value, unpaired, two-tailed Student's t test.
(C and F) Asterisks denote p values ≤ 0.03 as measured by unpaired, two-tailed Student's t test. (A–D, F) Data are from two experiments (mean ± SEM, n = 5–7).