
Figure 4. Impact of pDCs on Cytokine Production, DC Activation, and Early Anti-MCMV CD8+T Cell Responses.
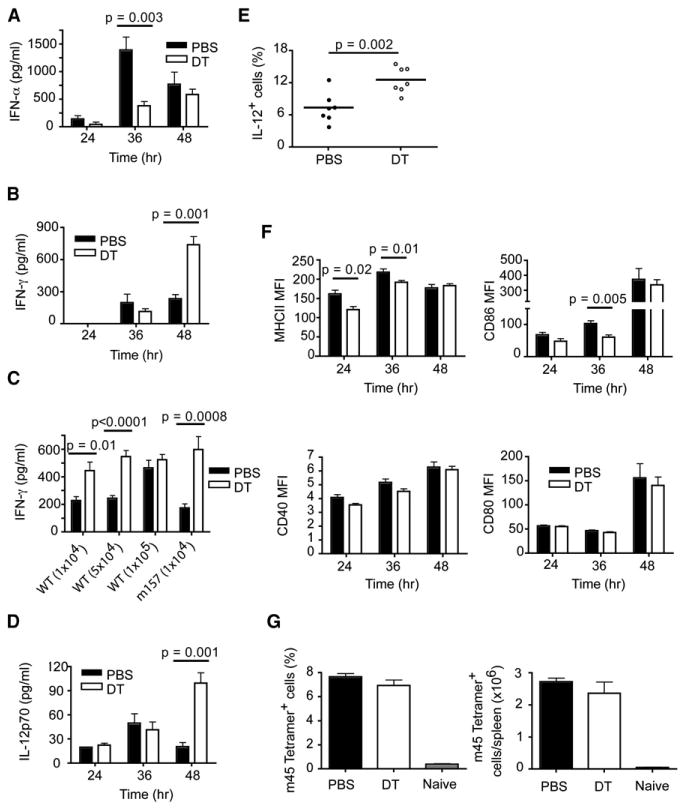
(A, B, D–G) PBS- and DT-treated mice were infected i.p. with 5 × 10⁴ pfu of MCMV and serum samples were analyzed for IFN-α (A), IFN-γ (B), and IL-12p70 (D).
(C) PBS- and DT-treated mice were infected i.p. with different doses of WT MCMV or Δm157 MCMV and serum IFN-γ concentrations were quantified 48 hr p.i.
(E) Frequencies of IL-12+CD11chi cells were determined 48 hr p.i. by intracellular staining.
(F) Expression based on mean fluorescence intensity (MFI) of costimulatory (CD86, CD40, CD80) and MHC class II molecules on CD11chi DCs.
(G) Frequencies and absolute numbers of Ag-specific CD8+ T cells on day 6 p.i.
p value, unpaired, two-tailed Student's t test. Data are from two (A, B, D–G) or three (C) experiments (mean ± SEM, n = 5–25).